Central American Indian vs Subsaharan African Median Family Income
COMPARE
Central American Indian
Subsaharan African
Median Family Income
Median Family Income Comparison
Central American Indians
Sub-Saharan Africans
$88,034
MEDIAN FAMILY INCOME
0.1/ 100
METRIC RATING
289th/ 347
METRIC RANK
$93,748
MEDIAN FAMILY INCOME
1.0/ 100
METRIC RATING
244th/ 347
METRIC RANK
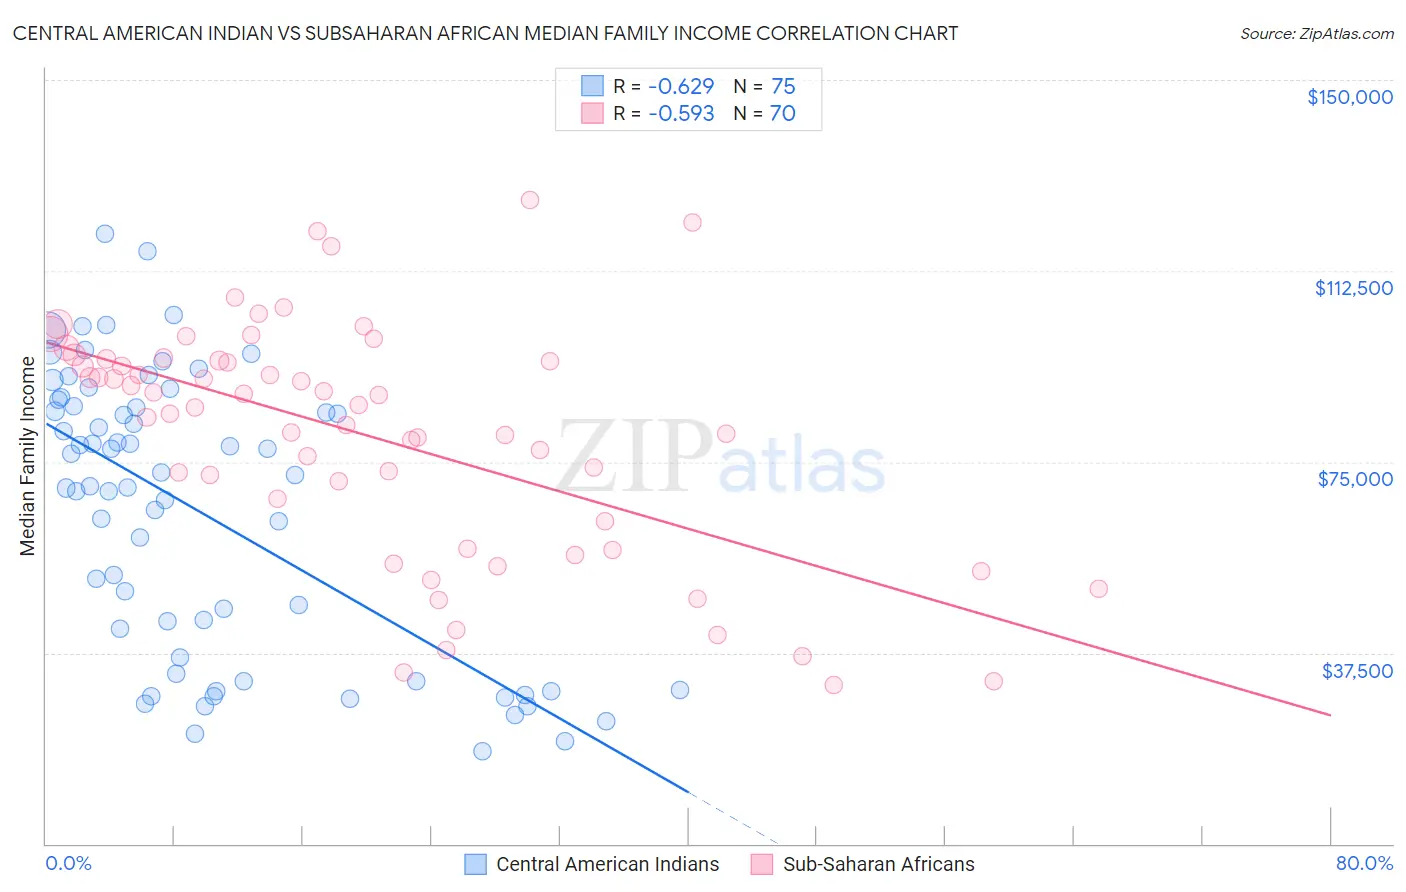
Central American Indian vs Subsaharan African Median Family Income Correlation Chart
The statistical analysis conducted on geographies consisting of 326,005,427 people shows a significant negative correlation between the proportion of Central American Indians and median family income in the United States with a correlation coefficient (R) of -0.629 and weighted average of $88,034. Similarly, the statistical analysis conducted on geographies consisting of 507,233,451 people shows a substantial negative correlation between the proportion of Sub-Saharan Africans and median family income in the United States with a correlation coefficient (R) of -0.593 and weighted average of $93,748, a difference of 6.5%.
Median Family Income Correlation Summary
| Measurement | Central American Indian | Subsaharan African |
| Minimum | $18,167 | $31,084 |
| Maximum | $119,681 | $126,507 |
| Range | $101,514 | $95,423 |
| Mean | $65,085 | $80,060 |
| Median | $70,092 | $85,890 |
| Interquartile 25% (IQ1) | $33,434 | $63,281 |
| Interquartile 75% (IQ3) | $85,864 | $94,886 |
| Interquartile Range (IQR) | $52,430 | $31,605 |
| Standard Deviation (Sample) | $27,378 | $22,942 |
| Standard Deviation (Population) | $27,195 | $22,778 |
Similar Demographics by Median Family Income
Demographics Similar to Central American Indians by Median Family Income
In terms of median family income, the demographic groups most similar to Central American Indians are Shoshone ($87,872, a difference of 0.19%), Cherokee ($88,209, a difference of 0.20%), Immigrants from Cabo Verde ($87,830, a difference of 0.23%), African ($87,820, a difference of 0.24%), and Immigrants from Nicaragua ($88,267, a difference of 0.26%).
| Demographics | Rating | Rank | Median Family Income |
| Comanche | 0.1 /100 | #282 | Tragic $88,556 |
| Bangladeshis | 0.1 /100 | #283 | Tragic $88,358 |
| Indonesians | 0.1 /100 | #284 | Tragic $88,301 |
| Guatemalans | 0.1 /100 | #285 | Tragic $88,295 |
| Immigrants | Nicaragua | 0.1 /100 | #286 | Tragic $88,267 |
| Potawatomi | 0.1 /100 | #287 | Tragic $88,265 |
| Cherokee | 0.1 /100 | #288 | Tragic $88,209 |
| Central American Indians | 0.1 /100 | #289 | Tragic $88,034 |
| Shoshone | 0.1 /100 | #290 | Tragic $87,872 |
| Immigrants | Cabo Verde | 0.1 /100 | #291 | Tragic $87,830 |
| Africans | 0.1 /100 | #292 | Tragic $87,820 |
| Ute | 0.0 /100 | #293 | Tragic $87,596 |
| Fijians | 0.0 /100 | #294 | Tragic $87,387 |
| Yaqui | 0.0 /100 | #295 | Tragic $87,289 |
| Immigrants | Guatemala | 0.0 /100 | #296 | Tragic $87,191 |
Demographics Similar to Sub-Saharan Africans by Median Family Income
In terms of median family income, the demographic groups most similar to Sub-Saharan Africans are German Russian ($93,858, a difference of 0.12%), Immigrants from Middle Africa ($93,593, a difference of 0.17%), Barbadian ($93,919, a difference of 0.18%), Immigrants from Trinidad and Tobago ($93,988, a difference of 0.26%), and Somali ($94,085, a difference of 0.36%).
| Demographics | Rating | Rank | Median Family Income |
| Alaskan Athabascans | 1.5 /100 | #237 | Tragic $94,429 |
| Nepalese | 1.3 /100 | #238 | Tragic $94,153 |
| Salvadorans | 1.2 /100 | #239 | Tragic $94,109 |
| Somalis | 1.2 /100 | #240 | Tragic $94,085 |
| Immigrants | Trinidad and Tobago | 1.2 /100 | #241 | Tragic $93,988 |
| Barbadians | 1.1 /100 | #242 | Tragic $93,919 |
| German Russians | 1.1 /100 | #243 | Tragic $93,858 |
| Sub-Saharan Africans | 1.0 /100 | #244 | Tragic $93,748 |
| Immigrants | Middle Africa | 1.0 /100 | #245 | Tragic $93,593 |
| Guyanese | 0.9 /100 | #246 | Tragic $93,373 |
| Immigrants | Senegal | 0.7 /100 | #247 | Tragic $92,912 |
| French American Indians | 0.7 /100 | #248 | Tragic $92,872 |
| Immigrants | Ecuador | 0.7 /100 | #249 | Tragic $92,837 |
| West Indians | 0.6 /100 | #250 | Tragic $92,765 |
| Immigrants | Somalia | 0.6 /100 | #251 | Tragic $92,609 |