Immigrants from Bangladesh vs German Russian Householder Income Ages 45 - 64 years
COMPARE
Immigrants from Bangladesh
German Russian
Householder Income Ages 45 - 64 years
Householder Income Ages 45 - 64 years Comparison
Immigrants from Bangladesh
German Russians
$92,208
HOUSEHOLDER INCOME AGES 45 - 64 YEARS
1.7/ 100
METRIC RATING
237th/ 347
METRIC RANK
$89,398
HOUSEHOLDER INCOME AGES 45 - 64 YEARS
0.4/ 100
METRIC RATING
257th/ 347
METRIC RANK
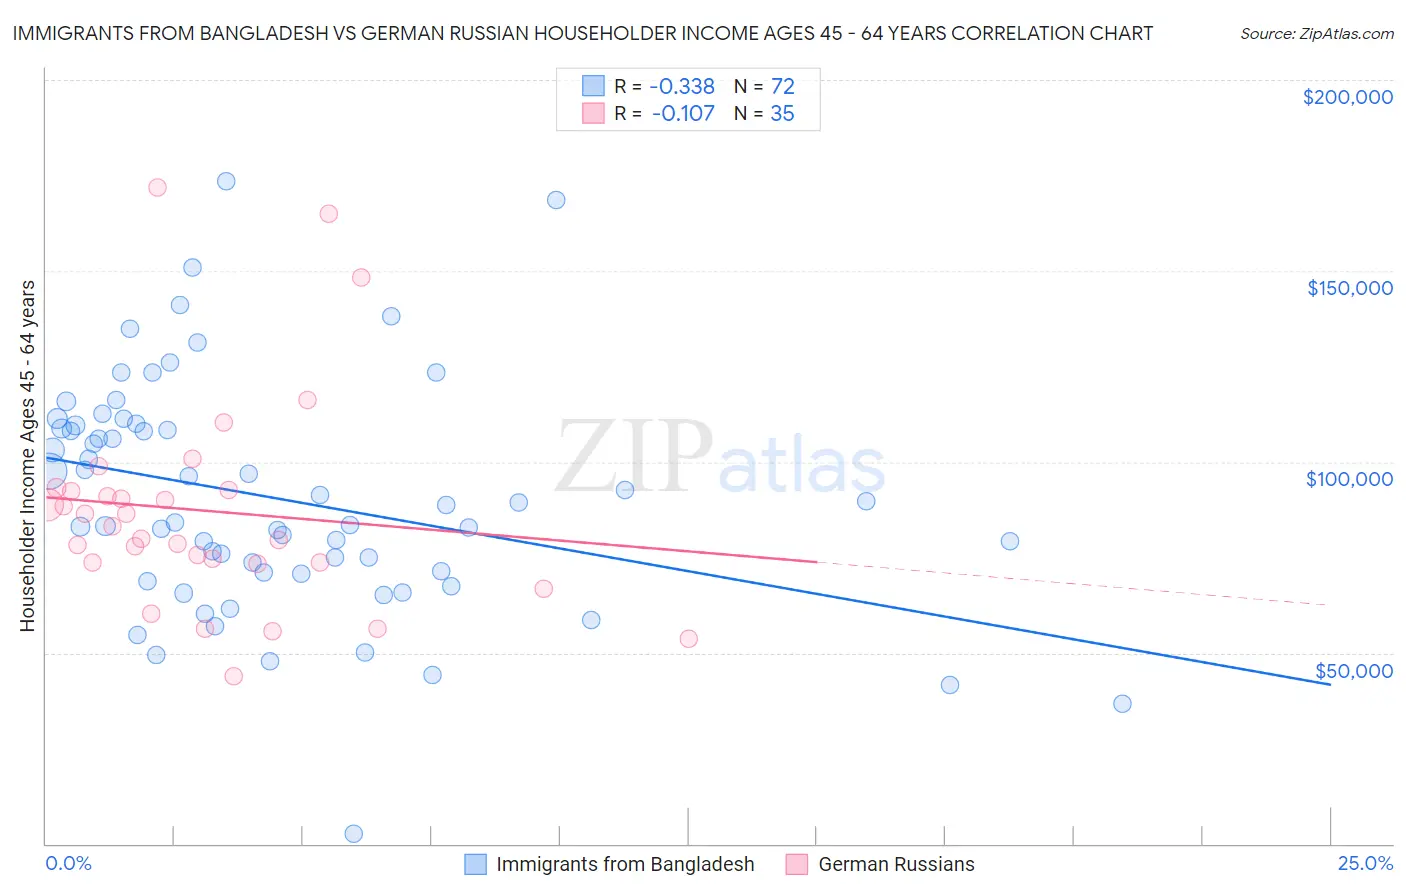
Immigrants from Bangladesh vs German Russian Householder Income Ages 45 - 64 years Correlation Chart
The statistical analysis conducted on geographies consisting of 203,437,833 people shows a mild negative correlation between the proportion of Immigrants from Bangladesh and household income with householder between the ages 45 and 64 in the United States with a correlation coefficient (R) of -0.338 and weighted average of $92,208. Similarly, the statistical analysis conducted on geographies consisting of 96,410,243 people shows a poor negative correlation between the proportion of German Russians and household income with householder between the ages 45 and 64 in the United States with a correlation coefficient (R) of -0.107 and weighted average of $89,398, a difference of 3.1%.
Householder Income Ages 45 - 64 years Correlation Summary
| Measurement | Immigrants from Bangladesh | German Russian |
| Minimum | $2,499 | $43,750 |
| Maximum | $173,347 | $171,788 |
| Range | $170,848 | $128,038 |
| Mean | $90,304 | $87,182 |
| Median | $86,504 | $83,043 |
| Interquartile 25% (IQ1) | $70,928 | $73,744 |
| Interquartile 75% (IQ3) | $109,175 | $92,651 |
| Interquartile Range (IQR) | $38,247 | $18,907 |
| Standard Deviation (Sample) | $30,699 | $28,210 |
| Standard Deviation (Population) | $30,485 | $27,804 |
Demographics Similar to Immigrants from Bangladesh and German Russians by Householder Income Ages 45 - 64 years
In terms of householder income ages 45 - 64 years, the demographic groups most similar to Immigrants from Bangladesh are Pennsylvania German ($91,956, a difference of 0.27%), Immigrants from Ecuador ($91,462, a difference of 0.82%), Immigrants from Burma/Myanmar ($91,385, a difference of 0.90%), Trinidadian and Tobagonian ($91,357, a difference of 0.93%), and Inupiat ($91,355, a difference of 0.93%). Similarly, the demographic groups most similar to German Russians are French American Indian ($89,811, a difference of 0.46%), West Indian ($89,906, a difference of 0.57%), Immigrants from Guyana ($90,186, a difference of 0.88%), Barbadian ($90,266, a difference of 0.97%), and Marshallese ($90,455, a difference of 1.2%).
| Demographics | Rating | Rank | Householder Income Ages 45 - 64 years |
| Immigrants | Bangladesh | 1.7 /100 | #237 | Tragic $92,208 |
| Pennsylvania Germans | 1.5 /100 | #238 | Tragic $91,956 |
| Immigrants | Ecuador | 1.2 /100 | #239 | Tragic $91,462 |
| Immigrants | Burma/Myanmar | 1.1 /100 | #240 | Tragic $91,385 |
| Trinidadians and Tobagonians | 1.1 /100 | #241 | Tragic $91,357 |
| Inupiat | 1.1 /100 | #242 | Tragic $91,355 |
| Immigrants | Trinidad and Tobago | 1.1 /100 | #243 | Tragic $91,347 |
| Immigrants | Middle Africa | 1.1 /100 | #244 | Tragic $91,293 |
| Guyanese | 0.9 /100 | #245 | Tragic $90,966 |
| Central Americans | 0.9 /100 | #246 | Tragic $90,951 |
| Alaskan Athabascans | 0.9 /100 | #247 | Tragic $90,951 |
| Immigrants | Laos | 0.9 /100 | #248 | Tragic $90,909 |
| Mexican American Indians | 0.8 /100 | #249 | Tragic $90,811 |
| Sub-Saharan Africans | 0.8 /100 | #250 | Tragic $90,691 |
| Americans | 0.7 /100 | #251 | Tragic $90,536 |
| Marshallese | 0.7 /100 | #252 | Tragic $90,455 |
| Barbadians | 0.6 /100 | #253 | Tragic $90,266 |
| Immigrants | Guyana | 0.6 /100 | #254 | Tragic $90,186 |
| West Indians | 0.5 /100 | #255 | Tragic $89,906 |
| French American Indians | 0.5 /100 | #256 | Tragic $89,811 |
| German Russians | 0.4 /100 | #257 | Tragic $89,398 |