Cape Verdean vs Yaqui Householder Income Ages 45 - 64 years
COMPARE
Cape Verdean
Yaqui
Householder Income Ages 45 - 64 years
Householder Income Ages 45 - 64 years Comparison
Cape Verdeans
Yaqui
$87,580
HOUSEHOLDER INCOME AGES 45 - 64 YEARS
0.2/ 100
METRIC RATING
272nd/ 347
METRIC RANK
$86,914
HOUSEHOLDER INCOME AGES 45 - 64 YEARS
0.1/ 100
METRIC RATING
281st/ 347
METRIC RANK
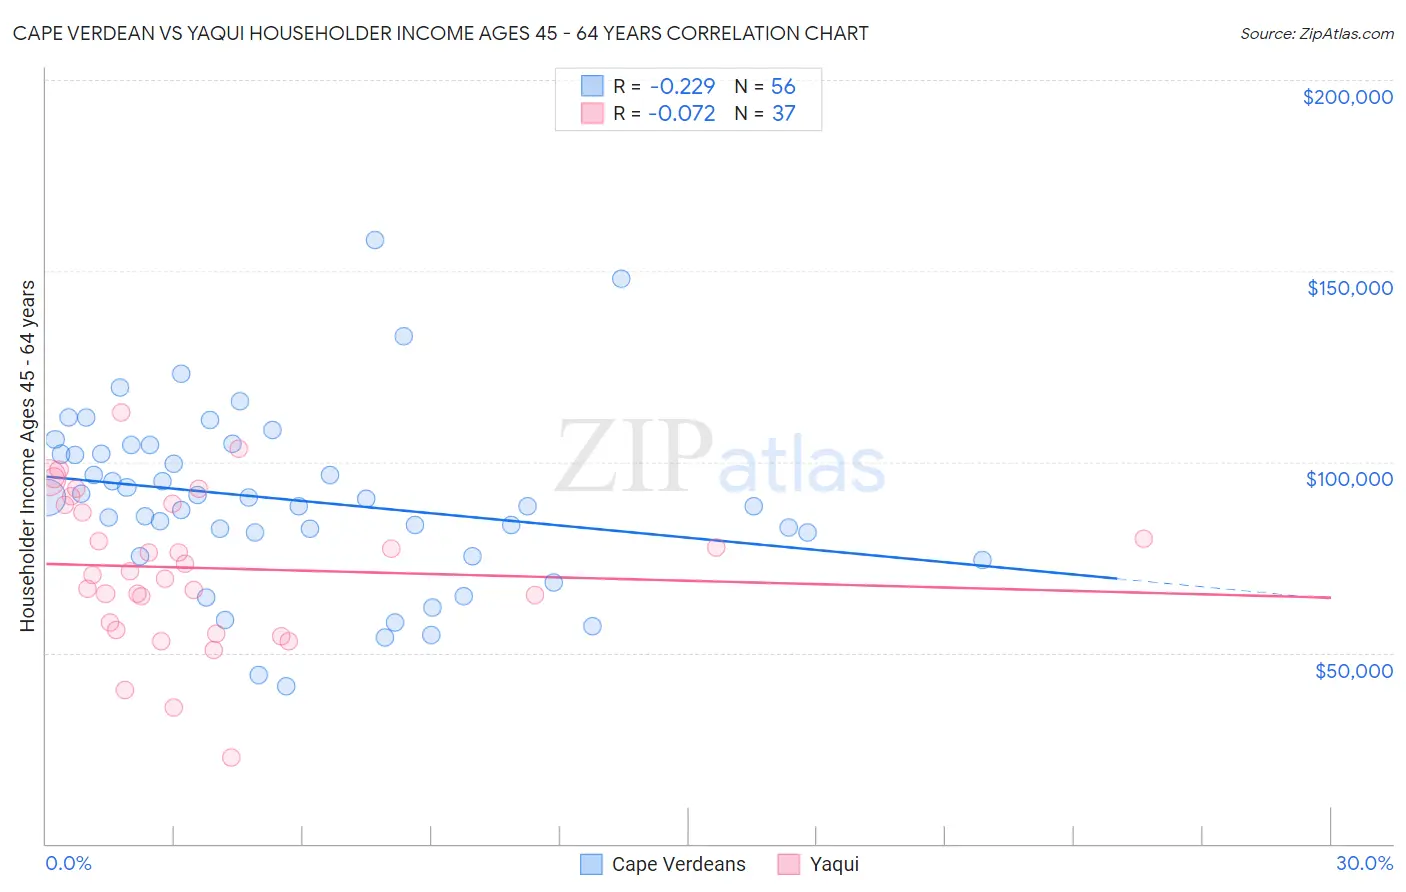
Cape Verdean vs Yaqui Householder Income Ages 45 - 64 years Correlation Chart
The statistical analysis conducted on geographies consisting of 107,500,216 people shows a weak negative correlation between the proportion of Cape Verdeans and household income with householder between the ages 45 and 64 in the United States with a correlation coefficient (R) of -0.229 and weighted average of $87,580. Similarly, the statistical analysis conducted on geographies consisting of 107,688,425 people shows a slight negative correlation between the proportion of Yaqui and household income with householder between the ages 45 and 64 in the United States with a correlation coefficient (R) of -0.072 and weighted average of $86,914, a difference of 0.77%.
Householder Income Ages 45 - 64 years Correlation Summary
| Measurement | Cape Verdean | Yaqui |
| Minimum | $41,310 | $22,708 |
| Maximum | $158,026 | $112,855 |
| Range | $116,716 | $90,147 |
| Mean | $89,896 | $72,181 |
| Median | $89,458 | $71,412 |
| Interquartile 25% (IQ1) | $78,368 | $56,921 |
| Interquartile 75% (IQ3) | $103,256 | $88,961 |
| Interquartile Range (IQR) | $24,888 | $32,041 |
| Standard Deviation (Sample) | $23,178 | $19,685 |
| Standard Deviation (Population) | $22,970 | $19,417 |
Demographics Similar to Cape Verdeans and Yaqui by Householder Income Ages 45 - 64 years
In terms of householder income ages 45 - 64 years, the demographic groups most similar to Cape Verdeans are Spanish American Indian ($87,561, a difference of 0.020%), Guatemalan ($87,705, a difference of 0.14%), Immigrants from Liberia ($87,739, a difference of 0.18%), Spanish American ($87,836, a difference of 0.29%), and Immigrants from Micronesia ($87,864, a difference of 0.32%). Similarly, the demographic groups most similar to Yaqui are Senegalese ($86,897, a difference of 0.020%), Immigrants from Somalia ($86,987, a difference of 0.080%), Yakama ($86,992, a difference of 0.090%), Mexican ($86,816, a difference of 0.11%), and Immigrants from Jamaica ($87,035, a difference of 0.14%).
| Demographics | Rating | Rank | Householder Income Ages 45 - 64 years |
| Immigrants | West Indies | 0.2 /100 | #266 | Tragic $88,164 |
| Hmong | 0.2 /100 | #267 | Tragic $88,115 |
| Immigrants | Micronesia | 0.2 /100 | #268 | Tragic $87,864 |
| Spanish Americans | 0.2 /100 | #269 | Tragic $87,836 |
| Immigrants | Liberia | 0.2 /100 | #270 | Tragic $87,739 |
| Guatemalans | 0.2 /100 | #271 | Tragic $87,705 |
| Cape Verdeans | 0.2 /100 | #272 | Tragic $87,580 |
| Spanish American Indians | 0.2 /100 | #273 | Tragic $87,561 |
| Iroquois | 0.1 /100 | #274 | Tragic $87,255 |
| Immigrants | Belize | 0.1 /100 | #275 | Tragic $87,229 |
| Immigrants | Latin America | 0.1 /100 | #276 | Tragic $87,219 |
| Cree | 0.1 /100 | #277 | Tragic $87,185 |
| Immigrants | Jamaica | 0.1 /100 | #278 | Tragic $87,035 |
| Yakama | 0.1 /100 | #279 | Tragic $86,992 |
| Immigrants | Somalia | 0.1 /100 | #280 | Tragic $86,987 |
| Yaqui | 0.1 /100 | #281 | Tragic $86,914 |
| Senegalese | 0.1 /100 | #282 | Tragic $86,897 |
| Mexicans | 0.1 /100 | #283 | Tragic $86,816 |
| Central American Indians | 0.1 /100 | #284 | Tragic $86,764 |
| Blackfeet | 0.1 /100 | #285 | Tragic $86,595 |
| Immigrants | Guatemala | 0.1 /100 | #286 | Tragic $86,573 |