Cape Verdean vs Immigrants from Northern Europe Householder Income Ages 45 - 64 years
COMPARE
Cape Verdean
Immigrants from Northern Europe
Householder Income Ages 45 - 64 years
Householder Income Ages 45 - 64 years Comparison
Cape Verdeans
Immigrants from Northern Europe
$87,580
HOUSEHOLDER INCOME AGES 45 - 64 YEARS
0.2/ 100
METRIC RATING
272nd/ 347
METRIC RANK
$117,930
HOUSEHOLDER INCOME AGES 45 - 64 YEARS
100.0/ 100
METRIC RATING
27th/ 347
METRIC RANK
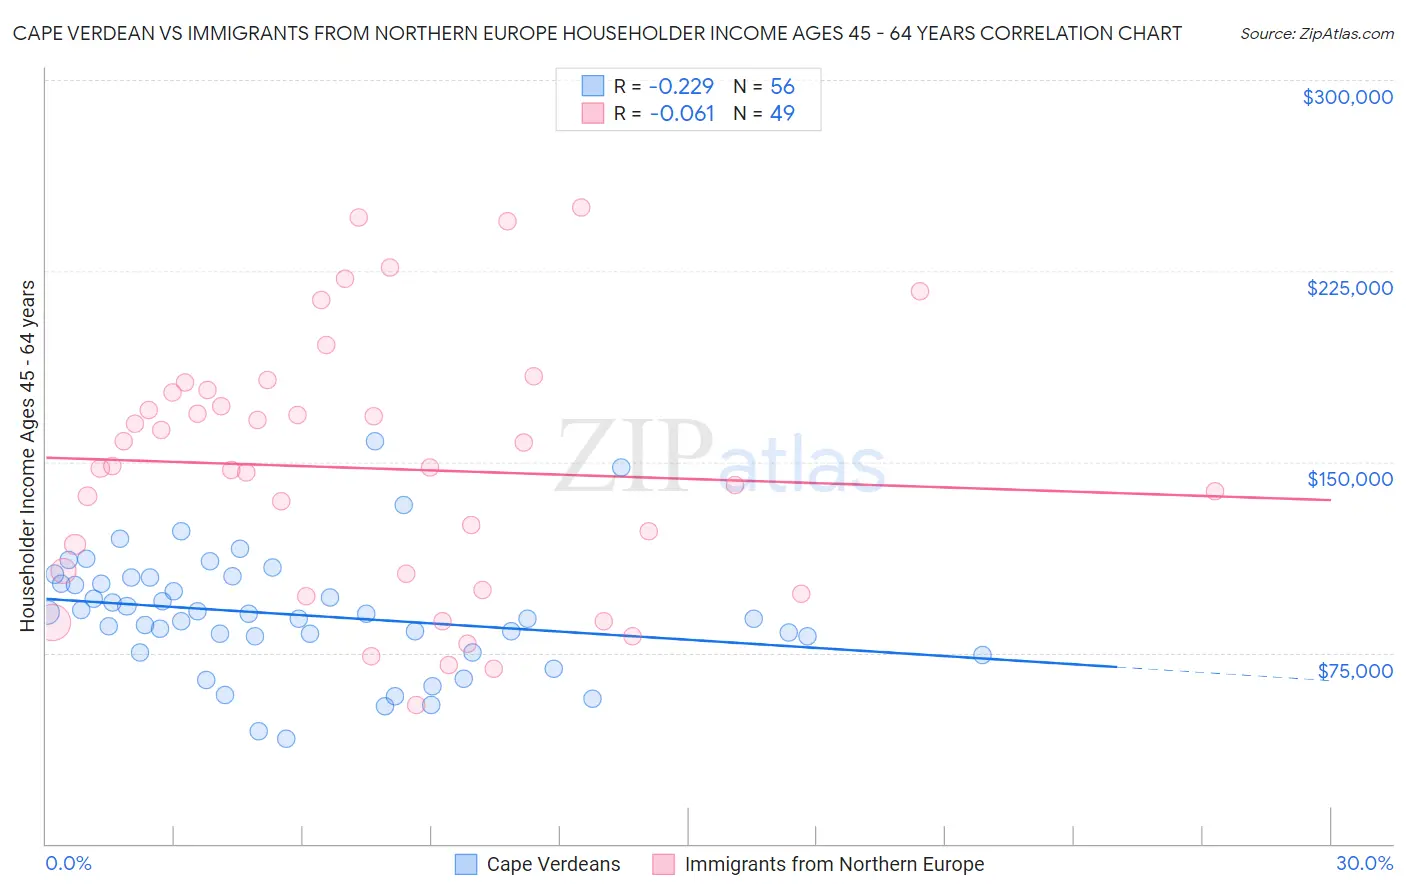
Cape Verdean vs Immigrants from Northern Europe Householder Income Ages 45 - 64 years Correlation Chart
The statistical analysis conducted on geographies consisting of 107,500,216 people shows a weak negative correlation between the proportion of Cape Verdeans and household income with householder between the ages 45 and 64 in the United States with a correlation coefficient (R) of -0.229 and weighted average of $87,580. Similarly, the statistical analysis conducted on geographies consisting of 476,061,115 people shows a slight negative correlation between the proportion of Immigrants from Northern Europe and household income with householder between the ages 45 and 64 in the United States with a correlation coefficient (R) of -0.061 and weighted average of $117,930, a difference of 34.6%.
Householder Income Ages 45 - 64 years Correlation Summary
| Measurement | Cape Verdean | Immigrants from Northern Europe |
| Minimum | $41,310 | $54,375 |
| Maximum | $158,026 | $250,001 |
| Range | $116,716 | $195,626 |
| Mean | $89,896 | $147,439 |
| Median | $89,458 | $147,652 |
| Interquartile 25% (IQ1) | $78,368 | $102,957 |
| Interquartile 75% (IQ3) | $103,256 | $177,734 |
| Interquartile Range (IQR) | $24,888 | $74,777 |
| Standard Deviation (Sample) | $23,178 | $50,256 |
| Standard Deviation (Population) | $22,970 | $49,741 |
Similar Demographics by Householder Income Ages 45 - 64 years
Demographics Similar to Cape Verdeans by Householder Income Ages 45 - 64 years
In terms of householder income ages 45 - 64 years, the demographic groups most similar to Cape Verdeans are Spanish American Indian ($87,561, a difference of 0.020%), Guatemalan ($87,705, a difference of 0.14%), Immigrants from Liberia ($87,739, a difference of 0.18%), Spanish American ($87,836, a difference of 0.29%), and Immigrants from Micronesia ($87,864, a difference of 0.32%).
| Demographics | Rating | Rank | Householder Income Ages 45 - 64 years |
| Jamaicans | 0.2 /100 | #265 | Tragic $88,327 |
| Immigrants | West Indies | 0.2 /100 | #266 | Tragic $88,164 |
| Hmong | 0.2 /100 | #267 | Tragic $88,115 |
| Immigrants | Micronesia | 0.2 /100 | #268 | Tragic $87,864 |
| Spanish Americans | 0.2 /100 | #269 | Tragic $87,836 |
| Immigrants | Liberia | 0.2 /100 | #270 | Tragic $87,739 |
| Guatemalans | 0.2 /100 | #271 | Tragic $87,705 |
| Cape Verdeans | 0.2 /100 | #272 | Tragic $87,580 |
| Spanish American Indians | 0.2 /100 | #273 | Tragic $87,561 |
| Iroquois | 0.1 /100 | #274 | Tragic $87,255 |
| Immigrants | Belize | 0.1 /100 | #275 | Tragic $87,229 |
| Immigrants | Latin America | 0.1 /100 | #276 | Tragic $87,219 |
| Cree | 0.1 /100 | #277 | Tragic $87,185 |
| Immigrants | Jamaica | 0.1 /100 | #278 | Tragic $87,035 |
| Yakama | 0.1 /100 | #279 | Tragic $86,992 |
Demographics Similar to Immigrants from Northern Europe by Householder Income Ages 45 - 64 years
In terms of householder income ages 45 - 64 years, the demographic groups most similar to Immigrants from Northern Europe are Turkish ($117,814, a difference of 0.10%), Bhutanese ($117,750, a difference of 0.15%), Immigrants from Bolivia ($117,731, a difference of 0.17%), Immigrants from Sweden ($118,318, a difference of 0.33%), and Asian ($118,426, a difference of 0.42%).
| Demographics | Rating | Rank | Householder Income Ages 45 - 64 years |
| Immigrants | Australia | 100.0 /100 | #20 | Exceptional $119,308 |
| Immigrants | Sri Lanka | 100.0 /100 | #21 | Exceptional $119,094 |
| Immigrants | Belgium | 100.0 /100 | #22 | Exceptional $118,932 |
| Bolivians | 100.0 /100 | #23 | Exceptional $118,871 |
| Immigrants | Japan | 100.0 /100 | #24 | Exceptional $118,498 |
| Asians | 100.0 /100 | #25 | Exceptional $118,426 |
| Immigrants | Sweden | 100.0 /100 | #26 | Exceptional $118,318 |
| Immigrants | Northern Europe | 100.0 /100 | #27 | Exceptional $117,930 |
| Turks | 100.0 /100 | #28 | Exceptional $117,814 |
| Bhutanese | 100.0 /100 | #29 | Exceptional $117,750 |
| Immigrants | Bolivia | 100.0 /100 | #30 | Exceptional $117,731 |
| Immigrants | Asia | 100.0 /100 | #31 | Exceptional $116,566 |
| Russians | 100.0 /100 | #32 | Exceptional $116,328 |
| Chinese | 100.0 /100 | #33 | Exceptional $116,156 |
| Immigrants | Denmark | 100.0 /100 | #34 | Exceptional $116,000 |