Cape Verdean vs Immigrants from Taiwan Householder Income Ages 45 - 64 years
COMPARE
Cape Verdean
Immigrants from Taiwan
Householder Income Ages 45 - 64 years
Householder Income Ages 45 - 64 years Comparison
Cape Verdeans
Immigrants from Taiwan
$87,580
HOUSEHOLDER INCOME AGES 45 - 64 YEARS
0.2/ 100
METRIC RATING
272nd/ 347
METRIC RANK
$135,508
HOUSEHOLDER INCOME AGES 45 - 64 YEARS
100.0/ 100
METRIC RATING
1st/ 347
METRIC RANK
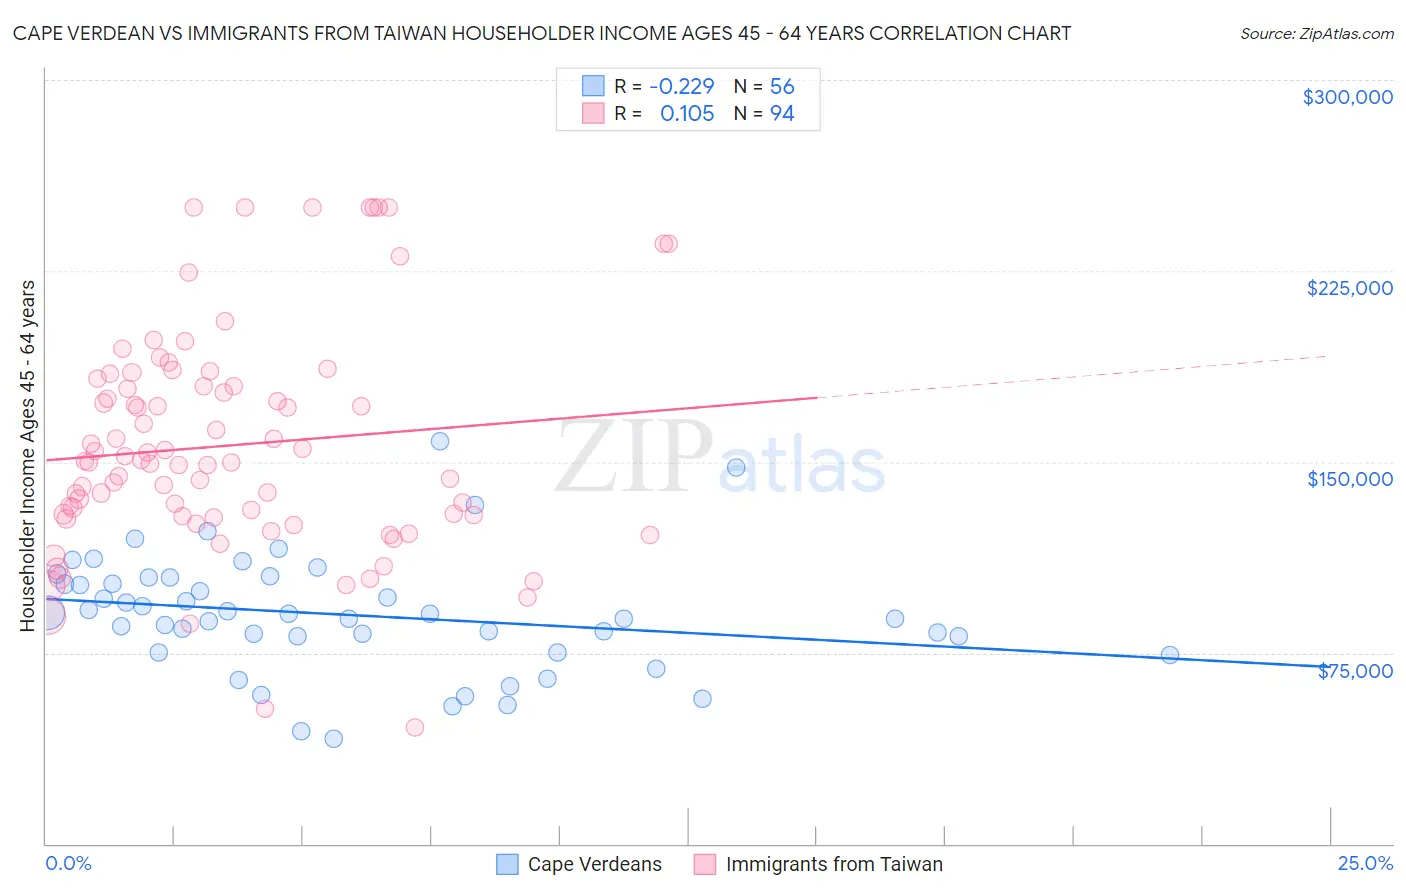
Cape Verdean vs Immigrants from Taiwan Householder Income Ages 45 - 64 years Correlation Chart
The statistical analysis conducted on geographies consisting of 107,500,216 people shows a weak negative correlation between the proportion of Cape Verdeans and household income with householder between the ages 45 and 64 in the United States with a correlation coefficient (R) of -0.229 and weighted average of $87,580. Similarly, the statistical analysis conducted on geographies consisting of 297,970,743 people shows a poor positive correlation between the proportion of Immigrants from Taiwan and household income with householder between the ages 45 and 64 in the United States with a correlation coefficient (R) of 0.105 and weighted average of $135,508, a difference of 54.7%.
Householder Income Ages 45 - 64 years Correlation Summary
| Measurement | Cape Verdean | Immigrants from Taiwan |
| Minimum | $41,310 | $45,758 |
| Maximum | $158,026 | $250,001 |
| Range | $116,716 | $204,243 |
| Mean | $89,896 | $156,467 |
| Median | $89,458 | $150,003 |
| Interquartile 25% (IQ1) | $78,368 | $128,525 |
| Interquartile 75% (IQ3) | $103,256 | $179,879 |
| Interquartile Range (IQR) | $24,888 | $51,354 |
| Standard Deviation (Sample) | $23,178 | $43,921 |
| Standard Deviation (Population) | $22,970 | $43,687 |
Similar Demographics by Householder Income Ages 45 - 64 years
Demographics Similar to Cape Verdeans by Householder Income Ages 45 - 64 years
In terms of householder income ages 45 - 64 years, the demographic groups most similar to Cape Verdeans are Spanish American Indian ($87,561, a difference of 0.020%), Guatemalan ($87,705, a difference of 0.14%), Immigrants from Liberia ($87,739, a difference of 0.18%), Spanish American ($87,836, a difference of 0.29%), and Immigrants from Micronesia ($87,864, a difference of 0.32%).
| Demographics | Rating | Rank | Householder Income Ages 45 - 64 years |
| Jamaicans | 0.2 /100 | #265 | Tragic $88,327 |
| Immigrants | West Indies | 0.2 /100 | #266 | Tragic $88,164 |
| Hmong | 0.2 /100 | #267 | Tragic $88,115 |
| Immigrants | Micronesia | 0.2 /100 | #268 | Tragic $87,864 |
| Spanish Americans | 0.2 /100 | #269 | Tragic $87,836 |
| Immigrants | Liberia | 0.2 /100 | #270 | Tragic $87,739 |
| Guatemalans | 0.2 /100 | #271 | Tragic $87,705 |
| Cape Verdeans | 0.2 /100 | #272 | Tragic $87,580 |
| Spanish American Indians | 0.2 /100 | #273 | Tragic $87,561 |
| Iroquois | 0.1 /100 | #274 | Tragic $87,255 |
| Immigrants | Belize | 0.1 /100 | #275 | Tragic $87,229 |
| Immigrants | Latin America | 0.1 /100 | #276 | Tragic $87,219 |
| Cree | 0.1 /100 | #277 | Tragic $87,185 |
| Immigrants | Jamaica | 0.1 /100 | #278 | Tragic $87,035 |
| Yakama | 0.1 /100 | #279 | Tragic $86,992 |
Demographics Similar to Immigrants from Taiwan by Householder Income Ages 45 - 64 years
In terms of householder income ages 45 - 64 years, the demographic groups most similar to Immigrants from Taiwan are Filipino ($134,910, a difference of 0.44%), Immigrants from India ($132,488, a difference of 2.3%), Thai ($129,560, a difference of 4.6%), Immigrants from Singapore ($129,514, a difference of 4.6%), and Iranian ($129,350, a difference of 4.8%).
| Demographics | Rating | Rank | Householder Income Ages 45 - 64 years |
| Immigrants | Taiwan | 100.0 /100 | #1 | Exceptional $135,508 |
| Filipinos | 100.0 /100 | #2 | Exceptional $134,910 |
| Immigrants | India | 100.0 /100 | #3 | Exceptional $132,488 |
| Thais | 100.0 /100 | #4 | Exceptional $129,560 |
| Immigrants | Singapore | 100.0 /100 | #5 | Exceptional $129,514 |
| Iranians | 100.0 /100 | #6 | Exceptional $129,350 |
| Immigrants | Hong Kong | 100.0 /100 | #7 | Exceptional $127,500 |
| Immigrants | Iran | 100.0 /100 | #8 | Exceptional $126,940 |
| Okinawans | 100.0 /100 | #9 | Exceptional $124,796 |
| Immigrants | South Central Asia | 100.0 /100 | #10 | Exceptional $124,188 |
| Cypriots | 100.0 /100 | #11 | Exceptional $123,396 |
| Immigrants | Israel | 100.0 /100 | #12 | Exceptional $122,893 |
| Immigrants | Ireland | 100.0 /100 | #13 | Exceptional $122,757 |
| Indians (Asian) | 100.0 /100 | #14 | Exceptional $122,343 |
| Immigrants | Eastern Asia | 100.0 /100 | #15 | Exceptional $122,222 |