Immigrants from Congo vs Yaqui Householder Income Ages 45 - 64 years
COMPARE
Immigrants from Congo
Yaqui
Householder Income Ages 45 - 64 years
Householder Income Ages 45 - 64 years Comparison
Immigrants from Congo
Yaqui
$77,850
HOUSEHOLDER INCOME AGES 45 - 64 YEARS
0.0/ 100
METRIC RATING
333rd/ 347
METRIC RANK
$86,914
HOUSEHOLDER INCOME AGES 45 - 64 YEARS
0.1/ 100
METRIC RATING
281st/ 347
METRIC RANK
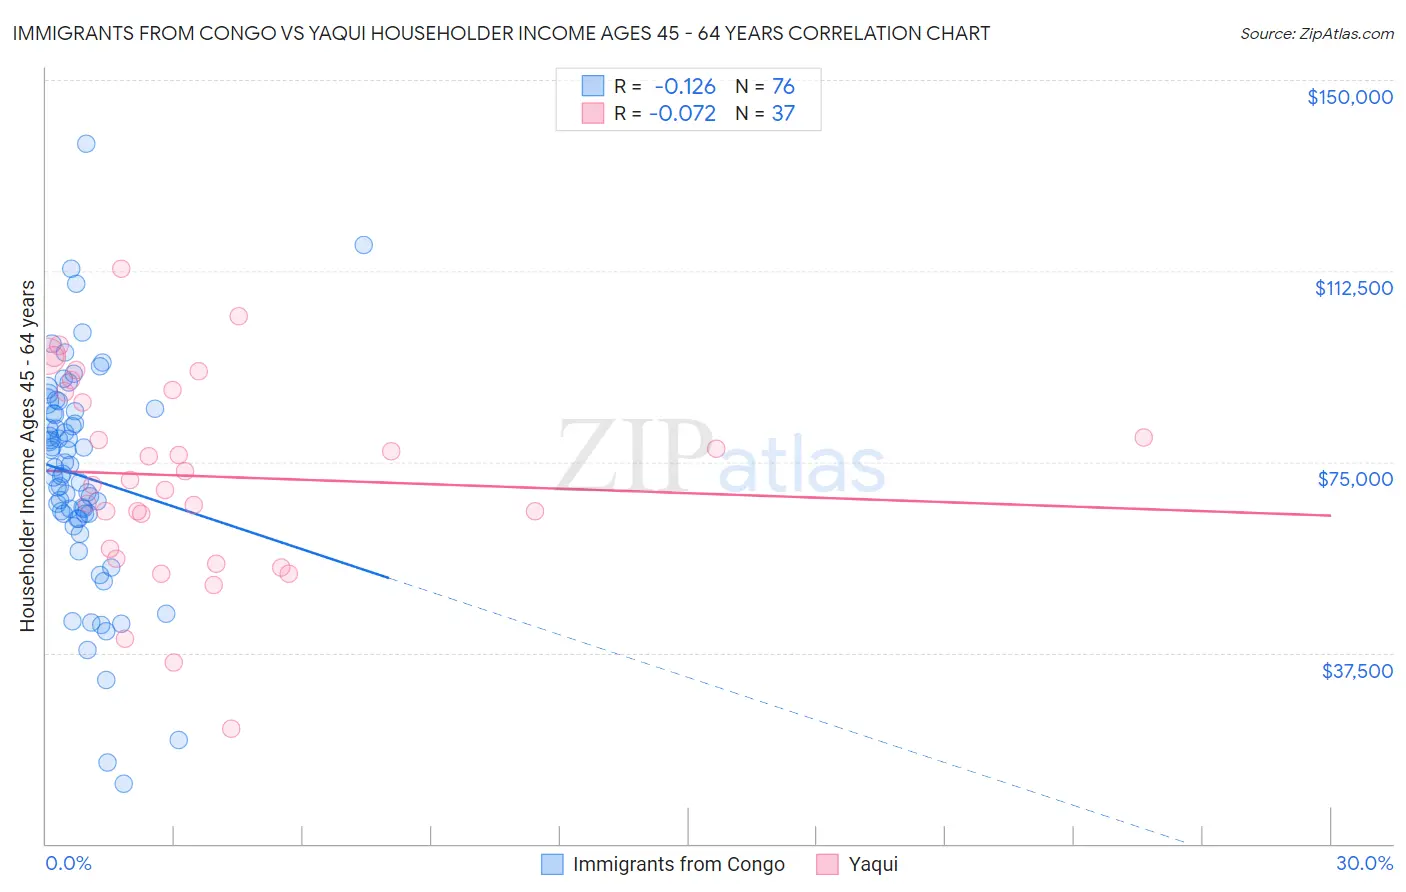
Immigrants from Congo vs Yaqui Householder Income Ages 45 - 64 years Correlation Chart
The statistical analysis conducted on geographies consisting of 92,054,371 people shows a poor negative correlation between the proportion of Immigrants from Congo and household income with householder between the ages 45 and 64 in the United States with a correlation coefficient (R) of -0.126 and weighted average of $77,850. Similarly, the statistical analysis conducted on geographies consisting of 107,688,425 people shows a slight negative correlation between the proportion of Yaqui and household income with householder between the ages 45 and 64 in the United States with a correlation coefficient (R) of -0.072 and weighted average of $86,914, a difference of 11.6%.
Householder Income Ages 45 - 64 years Correlation Summary
| Measurement | Immigrants from Congo | Yaqui |
| Minimum | $11,745 | $22,708 |
| Maximum | $137,368 | $112,855 |
| Range | $125,623 | $90,147 |
| Mean | $72,239 | $72,181 |
| Median | $73,295 | $71,412 |
| Interquartile 25% (IQ1) | $64,310 | $56,921 |
| Interquartile 75% (IQ3) | $84,654 | $88,961 |
| Interquartile Range (IQR) | $20,344 | $32,041 |
| Standard Deviation (Sample) | $21,800 | $19,685 |
| Standard Deviation (Population) | $21,656 | $19,417 |
Similar Demographics by Householder Income Ages 45 - 64 years
Demographics Similar to Immigrants from Congo by Householder Income Ages 45 - 64 years
In terms of householder income ages 45 - 64 years, the demographic groups most similar to Immigrants from Congo are Black/African American ($78,556, a difference of 0.91%), Menominee ($76,903, a difference of 1.2%), Immigrants from Dominican Republic ($78,836, a difference of 1.3%), Creek ($78,960, a difference of 1.4%), and Dutch West Indian ($79,171, a difference of 1.7%).
| Demographics | Rating | Rank | Householder Income Ages 45 - 64 years |
| Dominicans | 0.0 /100 | #326 | Tragic $80,623 |
| Seminole | 0.0 /100 | #327 | Tragic $80,077 |
| Natives/Alaskans | 0.0 /100 | #328 | Tragic $79,816 |
| Dutch West Indians | 0.0 /100 | #329 | Tragic $79,171 |
| Creek | 0.0 /100 | #330 | Tragic $78,960 |
| Immigrants | Dominican Republic | 0.0 /100 | #331 | Tragic $78,836 |
| Blacks/African Americans | 0.0 /100 | #332 | Tragic $78,556 |
| Immigrants | Congo | 0.0 /100 | #333 | Tragic $77,850 |
| Menominee | 0.0 /100 | #334 | Tragic $76,903 |
| Cheyenne | 0.0 /100 | #335 | Tragic $76,362 |
| Arapaho | 0.0 /100 | #336 | Tragic $75,945 |
| Pueblo | 0.0 /100 | #337 | Tragic $75,601 |
| Hopi | 0.0 /100 | #338 | Tragic $75,562 |
| Kiowa | 0.0 /100 | #339 | Tragic $74,815 |
| Immigrants | Yemen | 0.0 /100 | #340 | Tragic $74,575 |
Demographics Similar to Yaqui by Householder Income Ages 45 - 64 years
In terms of householder income ages 45 - 64 years, the demographic groups most similar to Yaqui are Senegalese ($86,897, a difference of 0.020%), Immigrants from Somalia ($86,987, a difference of 0.080%), Yakama ($86,992, a difference of 0.090%), Mexican ($86,816, a difference of 0.11%), and Immigrants from Jamaica ($87,035, a difference of 0.14%).
| Demographics | Rating | Rank | Householder Income Ages 45 - 64 years |
| Iroquois | 0.1 /100 | #274 | Tragic $87,255 |
| Immigrants | Belize | 0.1 /100 | #275 | Tragic $87,229 |
| Immigrants | Latin America | 0.1 /100 | #276 | Tragic $87,219 |
| Cree | 0.1 /100 | #277 | Tragic $87,185 |
| Immigrants | Jamaica | 0.1 /100 | #278 | Tragic $87,035 |
| Yakama | 0.1 /100 | #279 | Tragic $86,992 |
| Immigrants | Somalia | 0.1 /100 | #280 | Tragic $86,987 |
| Yaqui | 0.1 /100 | #281 | Tragic $86,914 |
| Senegalese | 0.1 /100 | #282 | Tragic $86,897 |
| Mexicans | 0.1 /100 | #283 | Tragic $86,816 |
| Central American Indians | 0.1 /100 | #284 | Tragic $86,764 |
| Blackfeet | 0.1 /100 | #285 | Tragic $86,595 |
| Immigrants | Guatemala | 0.1 /100 | #286 | Tragic $86,573 |
| Bangladeshis | 0.1 /100 | #287 | Tragic $86,402 |
| Immigrants | St. Vincent and the Grenadines | 0.1 /100 | #288 | Tragic $86,394 |