Colombian vs Yaqui Householder Income Ages 45 - 64 years
COMPARE
Colombian
Yaqui
Householder Income Ages 45 - 64 years
Householder Income Ages 45 - 64 years Comparison
Colombians
Yaqui
$99,772
HOUSEHOLDER INCOME AGES 45 - 64 YEARS
43.2/ 100
METRIC RATING
185th/ 347
METRIC RANK
$86,914
HOUSEHOLDER INCOME AGES 45 - 64 YEARS
0.1/ 100
METRIC RATING
281st/ 347
METRIC RANK
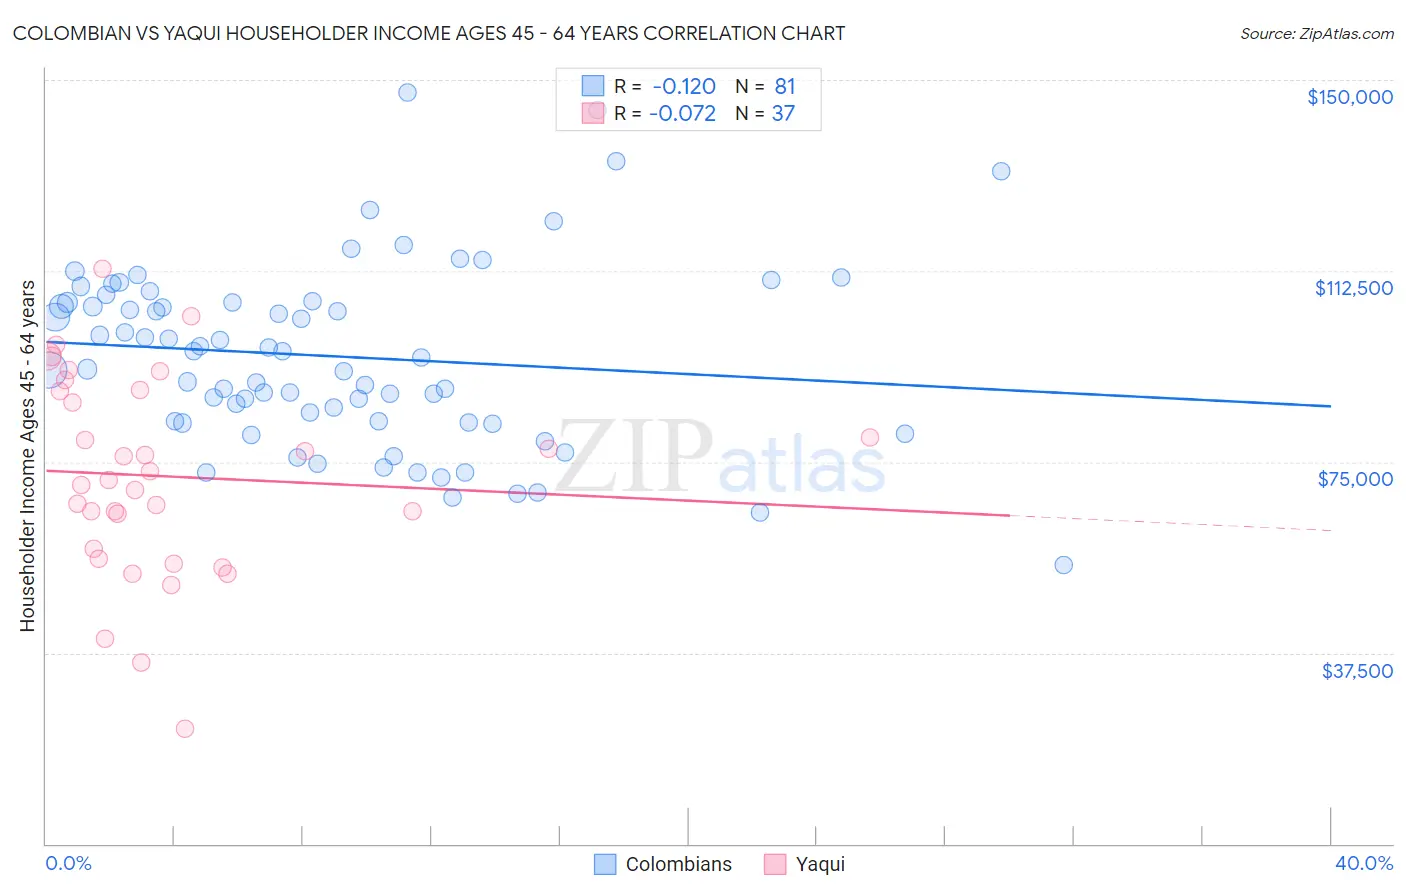
Colombian vs Yaqui Householder Income Ages 45 - 64 years Correlation Chart
The statistical analysis conducted on geographies consisting of 418,806,798 people shows a poor negative correlation between the proportion of Colombians and household income with householder between the ages 45 and 64 in the United States with a correlation coefficient (R) of -0.120 and weighted average of $99,772. Similarly, the statistical analysis conducted on geographies consisting of 107,688,425 people shows a slight negative correlation between the proportion of Yaqui and household income with householder between the ages 45 and 64 in the United States with a correlation coefficient (R) of -0.072 and weighted average of $86,914, a difference of 14.8%.
Householder Income Ages 45 - 64 years Correlation Summary
| Measurement | Colombian | Yaqui |
| Minimum | $54,659 | $22,708 |
| Maximum | $147,591 | $112,855 |
| Range | $92,932 | $90,147 |
| Mean | $95,720 | $72,181 |
| Median | $95,478 | $71,412 |
| Interquartile 25% (IQ1) | $82,814 | $56,921 |
| Interquartile 75% (IQ3) | $106,476 | $88,961 |
| Interquartile Range (IQR) | $23,662 | $32,041 |
| Standard Deviation (Sample) | $17,882 | $19,685 |
| Standard Deviation (Population) | $17,771 | $19,417 |
Similar Demographics by Householder Income Ages 45 - 64 years
Demographics Similar to Colombians by Householder Income Ages 45 - 64 years
In terms of householder income ages 45 - 64 years, the demographic groups most similar to Colombians are French ($99,824, a difference of 0.050%), Spaniard ($99,889, a difference of 0.12%), Dutch ($99,650, a difference of 0.12%), Finnish ($99,904, a difference of 0.13%), and Immigrants ($99,943, a difference of 0.17%).
| Demographics | Rating | Rank | Householder Income Ages 45 - 64 years |
| Immigrants | Cameroon | 47.0 /100 | #178 | Average $100,084 |
| Belgians | 46.7 /100 | #179 | Average $100,060 |
| Aleuts | 46.6 /100 | #180 | Average $100,052 |
| Immigrants | Immigrants | 45.3 /100 | #181 | Average $99,943 |
| Finns | 44.8 /100 | #182 | Average $99,904 |
| Spaniards | 44.6 /100 | #183 | Average $99,889 |
| French | 43.8 /100 | #184 | Average $99,824 |
| Colombians | 43.2 /100 | #185 | Average $99,772 |
| Dutch | 41.7 /100 | #186 | Average $99,650 |
| Iraqis | 38.5 /100 | #187 | Fair $99,387 |
| Immigrants | Portugal | 36.3 /100 | #188 | Fair $99,203 |
| Immigrants | South America | 35.4 /100 | #189 | Fair $99,126 |
| French Canadians | 35.1 /100 | #190 | Fair $99,093 |
| Kenyans | 33.7 /100 | #191 | Fair $98,970 |
| Celtics | 32.9 /100 | #192 | Fair $98,896 |
Demographics Similar to Yaqui by Householder Income Ages 45 - 64 years
In terms of householder income ages 45 - 64 years, the demographic groups most similar to Yaqui are Senegalese ($86,897, a difference of 0.020%), Immigrants from Somalia ($86,987, a difference of 0.080%), Yakama ($86,992, a difference of 0.090%), Mexican ($86,816, a difference of 0.11%), and Immigrants from Jamaica ($87,035, a difference of 0.14%).
| Demographics | Rating | Rank | Householder Income Ages 45 - 64 years |
| Iroquois | 0.1 /100 | #274 | Tragic $87,255 |
| Immigrants | Belize | 0.1 /100 | #275 | Tragic $87,229 |
| Immigrants | Latin America | 0.1 /100 | #276 | Tragic $87,219 |
| Cree | 0.1 /100 | #277 | Tragic $87,185 |
| Immigrants | Jamaica | 0.1 /100 | #278 | Tragic $87,035 |
| Yakama | 0.1 /100 | #279 | Tragic $86,992 |
| Immigrants | Somalia | 0.1 /100 | #280 | Tragic $86,987 |
| Yaqui | 0.1 /100 | #281 | Tragic $86,914 |
| Senegalese | 0.1 /100 | #282 | Tragic $86,897 |
| Mexicans | 0.1 /100 | #283 | Tragic $86,816 |
| Central American Indians | 0.1 /100 | #284 | Tragic $86,764 |
| Blackfeet | 0.1 /100 | #285 | Tragic $86,595 |
| Immigrants | Guatemala | 0.1 /100 | #286 | Tragic $86,573 |
| Bangladeshis | 0.1 /100 | #287 | Tragic $86,402 |
| Immigrants | St. Vincent and the Grenadines | 0.1 /100 | #288 | Tragic $86,394 |