Cape Verdean vs Basque Householder Income Ages 45 - 64 years
COMPARE
Cape Verdean
Basque
Householder Income Ages 45 - 64 years
Householder Income Ages 45 - 64 years Comparison
Cape Verdeans
Basques
$87,580
HOUSEHOLDER INCOME AGES 45 - 64 YEARS
0.2/ 100
METRIC RATING
272nd/ 347
METRIC RANK
$103,387
HOUSEHOLDER INCOME AGES 45 - 64 YEARS
82.3/ 100
METRIC RATING
147th/ 347
METRIC RANK
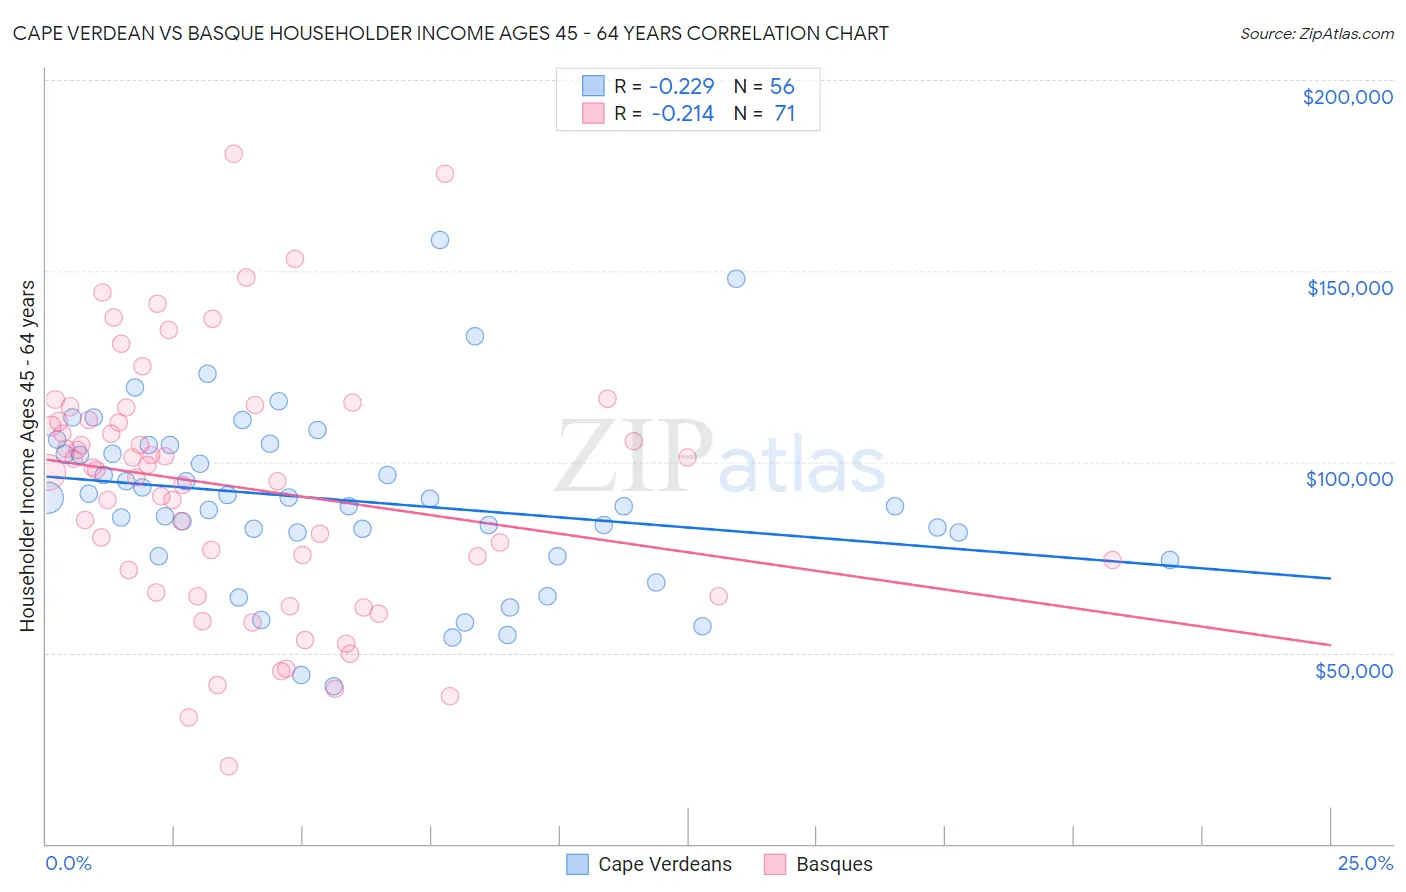
Cape Verdean vs Basque Householder Income Ages 45 - 64 years Correlation Chart
The statistical analysis conducted on geographies consisting of 107,500,216 people shows a weak negative correlation between the proportion of Cape Verdeans and household income with householder between the ages 45 and 64 in the United States with a correlation coefficient (R) of -0.229 and weighted average of $87,580. Similarly, the statistical analysis conducted on geographies consisting of 165,668,497 people shows a weak negative correlation between the proportion of Basques and household income with householder between the ages 45 and 64 in the United States with a correlation coefficient (R) of -0.214 and weighted average of $103,387, a difference of 18.0%.
Householder Income Ages 45 - 64 years Correlation Summary
| Measurement | Cape Verdean | Basque |
| Minimum | $41,310 | $20,417 |
| Maximum | $158,026 | $180,563 |
| Range | $116,716 | $160,146 |
| Mean | $89,896 | $93,413 |
| Median | $89,458 | $97,827 |
| Interquartile 25% (IQ1) | $78,368 | $65,865 |
| Interquartile 75% (IQ3) | $103,256 | $110,957 |
| Interquartile Range (IQR) | $24,888 | $45,092 |
| Standard Deviation (Sample) | $23,178 | $33,150 |
| Standard Deviation (Population) | $22,970 | $32,916 |
Similar Demographics by Householder Income Ages 45 - 64 years
Demographics Similar to Cape Verdeans by Householder Income Ages 45 - 64 years
In terms of householder income ages 45 - 64 years, the demographic groups most similar to Cape Verdeans are Spanish American Indian ($87,561, a difference of 0.020%), Guatemalan ($87,705, a difference of 0.14%), Immigrants from Liberia ($87,739, a difference of 0.18%), Spanish American ($87,836, a difference of 0.29%), and Immigrants from Micronesia ($87,864, a difference of 0.32%).
| Demographics | Rating | Rank | Householder Income Ages 45 - 64 years |
| Jamaicans | 0.2 /100 | #265 | Tragic $88,327 |
| Immigrants | West Indies | 0.2 /100 | #266 | Tragic $88,164 |
| Hmong | 0.2 /100 | #267 | Tragic $88,115 |
| Immigrants | Micronesia | 0.2 /100 | #268 | Tragic $87,864 |
| Spanish Americans | 0.2 /100 | #269 | Tragic $87,836 |
| Immigrants | Liberia | 0.2 /100 | #270 | Tragic $87,739 |
| Guatemalans | 0.2 /100 | #271 | Tragic $87,705 |
| Cape Verdeans | 0.2 /100 | #272 | Tragic $87,580 |
| Spanish American Indians | 0.2 /100 | #273 | Tragic $87,561 |
| Iroquois | 0.1 /100 | #274 | Tragic $87,255 |
| Immigrants | Belize | 0.1 /100 | #275 | Tragic $87,229 |
| Immigrants | Latin America | 0.1 /100 | #276 | Tragic $87,219 |
| Cree | 0.1 /100 | #277 | Tragic $87,185 |
| Immigrants | Jamaica | 0.1 /100 | #278 | Tragic $87,035 |
| Yakama | 0.1 /100 | #279 | Tragic $86,992 |
Demographics Similar to Basques by Householder Income Ages 45 - 64 years
In terms of householder income ages 45 - 64 years, the demographic groups most similar to Basques are Immigrants from Chile ($103,412, a difference of 0.020%), Ugandan ($103,472, a difference of 0.080%), Immigrants from Germany ($103,282, a difference of 0.10%), Czech ($103,507, a difference of 0.12%), and Serbian ($103,522, a difference of 0.13%).
| Demographics | Rating | Rank | Householder Income Ages 45 - 64 years |
| Norwegians | 84.3 /100 | #140 | Excellent $103,682 |
| Immigrants | Uganda | 83.7 /100 | #141 | Excellent $103,584 |
| Luxembourgers | 83.3 /100 | #142 | Excellent $103,536 |
| Serbians | 83.2 /100 | #143 | Excellent $103,522 |
| Czechs | 83.1 /100 | #144 | Excellent $103,507 |
| Ugandans | 82.9 /100 | #145 | Excellent $103,472 |
| Immigrants | Chile | 82.5 /100 | #146 | Excellent $103,412 |
| Basques | 82.3 /100 | #147 | Excellent $103,387 |
| Immigrants | Germany | 81.5 /100 | #148 | Excellent $103,282 |
| Immigrants | Sierra Leone | 81.1 /100 | #149 | Excellent $103,227 |
| Immigrants | Peru | 80.7 /100 | #150 | Excellent $103,173 |
| Swiss | 79.9 /100 | #151 | Good $103,071 |
| Irish | 79.8 /100 | #152 | Good $103,067 |
| Scandinavians | 79.0 /100 | #153 | Good $102,969 |
| Slovenes | 78.3 /100 | #154 | Good $102,885 |