Cherokee vs Yaqui Householder Income Ages 45 - 64 years
COMPARE
Cherokee
Yaqui
Householder Income Ages 45 - 64 years
Householder Income Ages 45 - 64 years Comparison
Cherokee
Yaqui
$86,125
HOUSEHOLDER INCOME AGES 45 - 64 YEARS
0.1/ 100
METRIC RATING
290th/ 347
METRIC RANK
$86,914
HOUSEHOLDER INCOME AGES 45 - 64 YEARS
0.1/ 100
METRIC RATING
281st/ 347
METRIC RANK
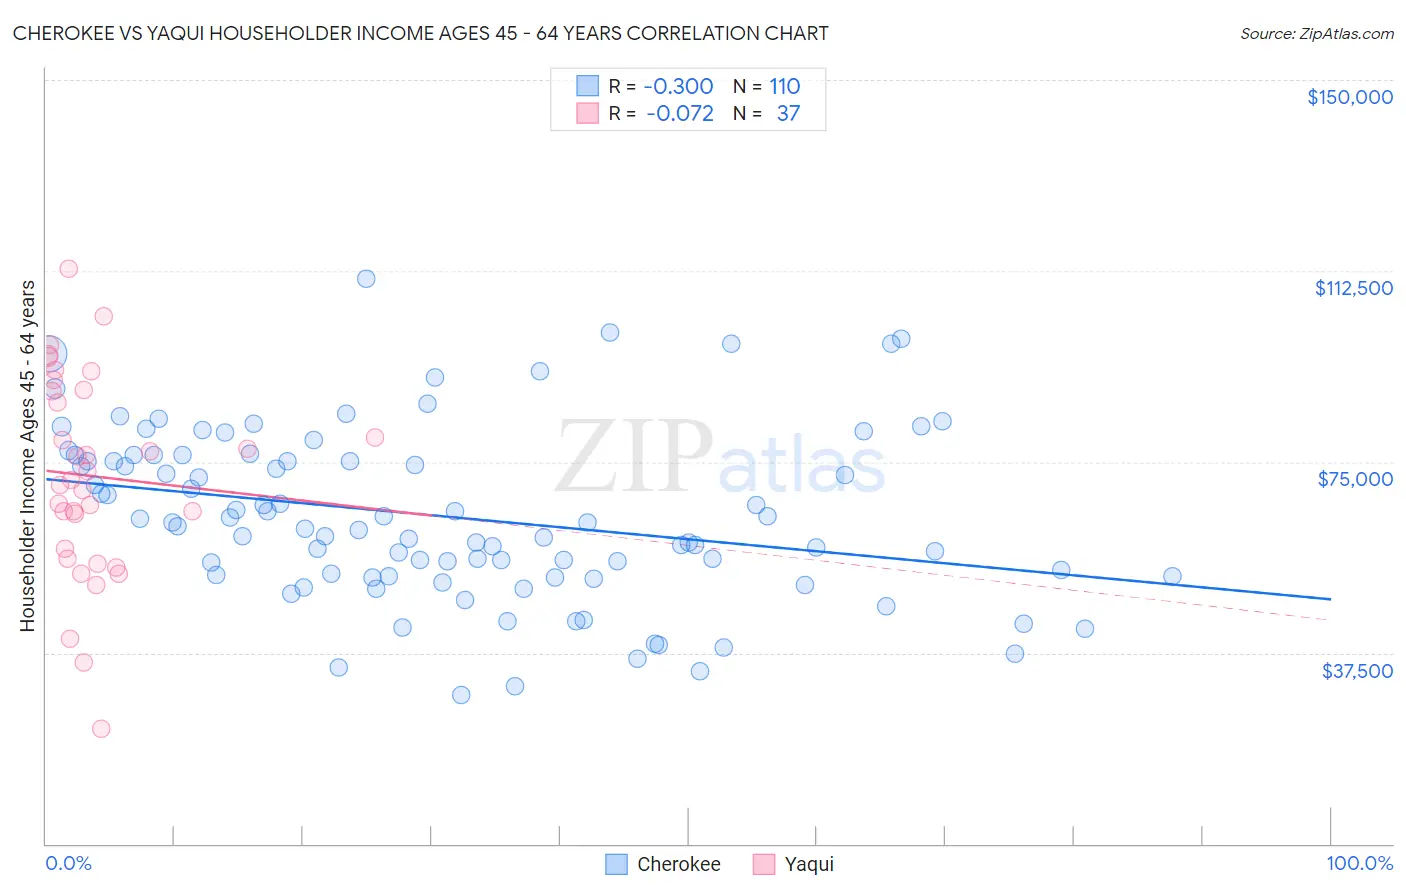
Cherokee vs Yaqui Householder Income Ages 45 - 64 years Correlation Chart
The statistical analysis conducted on geographies consisting of 491,799,921 people shows a mild negative correlation between the proportion of Cherokee and household income with householder between the ages 45 and 64 in the United States with a correlation coefficient (R) of -0.300 and weighted average of $86,125. Similarly, the statistical analysis conducted on geographies consisting of 107,688,425 people shows a slight negative correlation between the proportion of Yaqui and household income with householder between the ages 45 and 64 in the United States with a correlation coefficient (R) of -0.072 and weighted average of $86,914, a difference of 0.92%.
Householder Income Ages 45 - 64 years Correlation Summary
| Measurement | Cherokee | Yaqui |
| Minimum | $29,177 | $22,708 |
| Maximum | $110,921 | $112,855 |
| Range | $81,743 | $90,147 |
| Mean | $64,277 | $72,181 |
| Median | $62,715 | $71,412 |
| Interquartile 25% (IQ1) | $52,500 | $56,921 |
| Interquartile 75% (IQ3) | $76,245 | $88,961 |
| Interquartile Range (IQR) | $23,745 | $32,041 |
| Standard Deviation (Sample) | $16,781 | $19,685 |
| Standard Deviation (Population) | $16,705 | $19,417 |
Demographics Similar to Cherokee and Yaqui by Householder Income Ages 45 - 64 years
In terms of householder income ages 45 - 64 years, the demographic groups most similar to Cherokee are Hispanic or Latino ($86,006, a difference of 0.14%), Immigrants from Central America ($85,965, a difference of 0.19%), Cuban ($86,301, a difference of 0.20%), Immigrants from St. Vincent and the Grenadines ($86,394, a difference of 0.31%), and Bangladeshi ($86,402, a difference of 0.32%). Similarly, the demographic groups most similar to Yaqui are Senegalese ($86,897, a difference of 0.020%), Immigrants from Somalia ($86,987, a difference of 0.080%), Yakama ($86,992, a difference of 0.090%), Mexican ($86,816, a difference of 0.11%), and Immigrants from Jamaica ($87,035, a difference of 0.14%).
| Demographics | Rating | Rank | Householder Income Ages 45 - 64 years |
| Immigrants | Belize | 0.1 /100 | #275 | Tragic $87,229 |
| Immigrants | Latin America | 0.1 /100 | #276 | Tragic $87,219 |
| Cree | 0.1 /100 | #277 | Tragic $87,185 |
| Immigrants | Jamaica | 0.1 /100 | #278 | Tragic $87,035 |
| Yakama | 0.1 /100 | #279 | Tragic $86,992 |
| Immigrants | Somalia | 0.1 /100 | #280 | Tragic $86,987 |
| Yaqui | 0.1 /100 | #281 | Tragic $86,914 |
| Senegalese | 0.1 /100 | #282 | Tragic $86,897 |
| Mexicans | 0.1 /100 | #283 | Tragic $86,816 |
| Central American Indians | 0.1 /100 | #284 | Tragic $86,764 |
| Blackfeet | 0.1 /100 | #285 | Tragic $86,595 |
| Immigrants | Guatemala | 0.1 /100 | #286 | Tragic $86,573 |
| Bangladeshis | 0.1 /100 | #287 | Tragic $86,402 |
| Immigrants | St. Vincent and the Grenadines | 0.1 /100 | #288 | Tragic $86,394 |
| Cubans | 0.1 /100 | #289 | Tragic $86,301 |
| Cherokee | 0.1 /100 | #290 | Tragic $86,125 |
| Hispanics or Latinos | 0.1 /100 | #291 | Tragic $86,006 |
| Immigrants | Central America | 0.1 /100 | #292 | Tragic $85,965 |
| Comanche | 0.1 /100 | #293 | Tragic $85,787 |
| British West Indians | 0.1 /100 | #294 | Tragic $85,571 |
| Immigrants | Grenada | 0.1 /100 | #295 | Tragic $85,552 |