Indonesian vs Hawaiian Householder Income Ages 45 - 64 years
COMPARE
Indonesian
Hawaiian
Householder Income Ages 45 - 64 years
Householder Income Ages 45 - 64 years Comparison
Indonesians
Hawaiians
$84,890
HOUSEHOLDER INCOME AGES 45 - 64 YEARS
0.0/ 100
METRIC RATING
300th/ 347
METRIC RANK
$98,778
HOUSEHOLDER INCOME AGES 45 - 64 YEARS
31.6/ 100
METRIC RATING
193rd/ 347
METRIC RANK
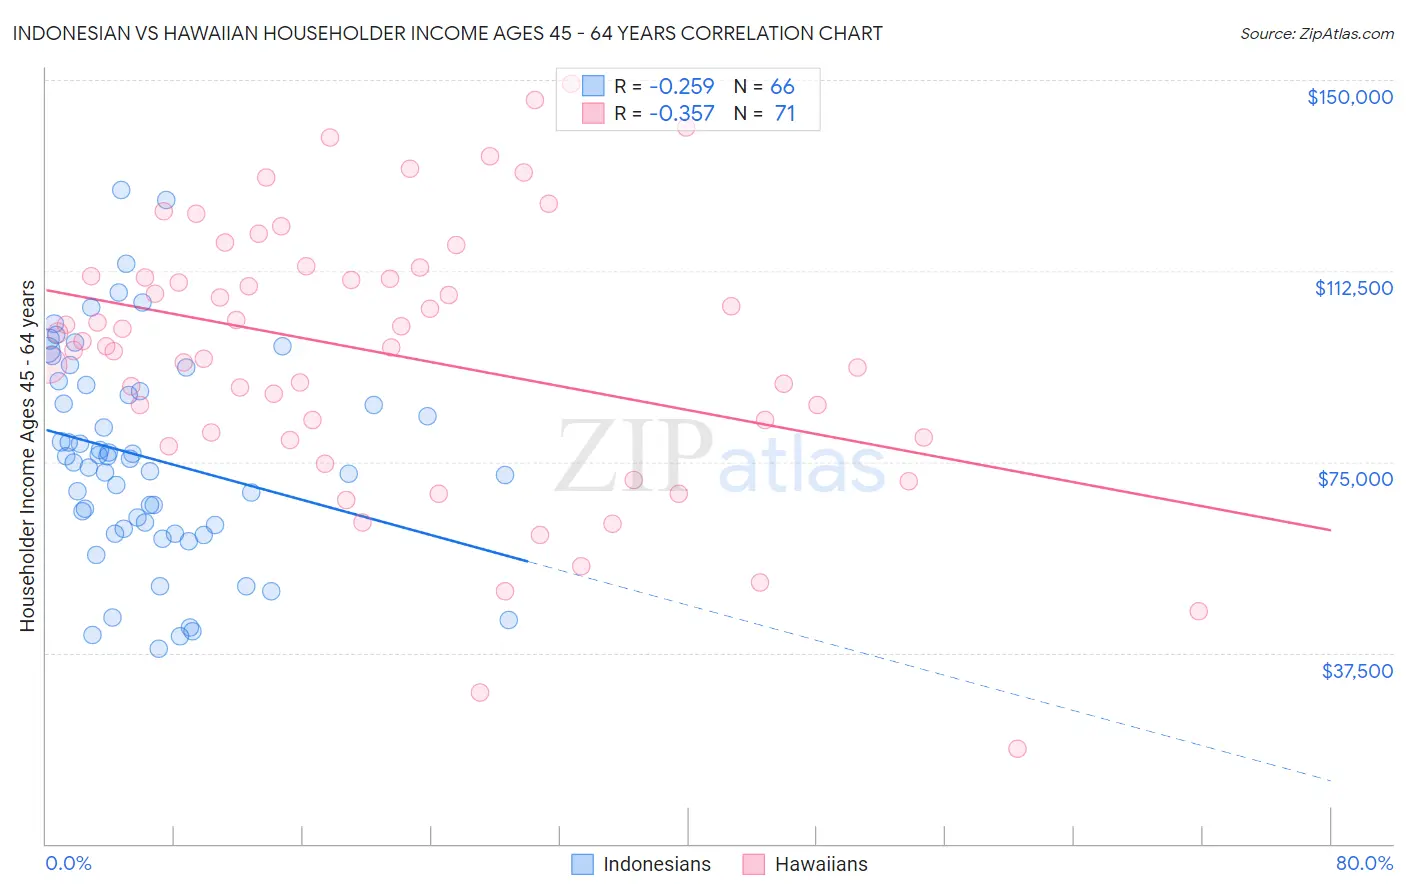
Indonesian vs Hawaiian Householder Income Ages 45 - 64 years Correlation Chart
The statistical analysis conducted on geographies consisting of 162,545,681 people shows a weak negative correlation between the proportion of Indonesians and household income with householder between the ages 45 and 64 in the United States with a correlation coefficient (R) of -0.259 and weighted average of $84,890. Similarly, the statistical analysis conducted on geographies consisting of 327,005,411 people shows a mild negative correlation between the proportion of Hawaiians and household income with householder between the ages 45 and 64 in the United States with a correlation coefficient (R) of -0.357 and weighted average of $98,778, a difference of 16.4%.
Householder Income Ages 45 - 64 years Correlation Summary
| Measurement | Indonesian | Hawaiian |
| Minimum | $38,314 | $18,640 |
| Maximum | $128,309 | $149,180 |
| Range | $89,995 | $130,540 |
| Mean | $75,761 | $96,039 |
| Median | $75,282 | $97,593 |
| Interquartile 25% (IQ1) | $61,778 | $79,762 |
| Interquartile 75% (IQ3) | $90,077 | $111,438 |
| Interquartile Range (IQR) | $28,299 | $31,676 |
| Standard Deviation (Sample) | $20,717 | $26,677 |
| Standard Deviation (Population) | $20,559 | $26,488 |
Similar Demographics by Householder Income Ages 45 - 64 years
Demographics Similar to Indonesians by Householder Income Ages 45 - 64 years
In terms of householder income ages 45 - 64 years, the demographic groups most similar to Indonesians are Immigrants from Mexico ($84,910, a difference of 0.020%), African ($84,925, a difference of 0.040%), Potawatomi ($84,613, a difference of 0.33%), Fijian ($85,187, a difference of 0.35%), and Immigrants from Zaire ($85,207, a difference of 0.37%).
| Demographics | Rating | Rank | Householder Income Ages 45 - 64 years |
| Comanche | 0.1 /100 | #293 | Tragic $85,787 |
| British West Indians | 0.1 /100 | #294 | Tragic $85,571 |
| Immigrants | Grenada | 0.1 /100 | #295 | Tragic $85,552 |
| Immigrants | Zaire | 0.1 /100 | #296 | Tragic $85,207 |
| Fijians | 0.1 /100 | #297 | Tragic $85,187 |
| Africans | 0.0 /100 | #298 | Tragic $84,925 |
| Immigrants | Mexico | 0.0 /100 | #299 | Tragic $84,910 |
| Indonesians | 0.0 /100 | #300 | Tragic $84,890 |
| Potawatomi | 0.0 /100 | #301 | Tragic $84,613 |
| Haitians | 0.0 /100 | #302 | Tragic $84,384 |
| Hondurans | 0.0 /100 | #303 | Tragic $84,079 |
| Ottawa | 0.0 /100 | #304 | Tragic $83,953 |
| Chippewa | 0.0 /100 | #305 | Tragic $83,943 |
| Ute | 0.0 /100 | #306 | Tragic $83,937 |
| Shoshone | 0.0 /100 | #307 | Tragic $83,588 |
Demographics Similar to Hawaiians by Householder Income Ages 45 - 64 years
In terms of householder income ages 45 - 64 years, the demographic groups most similar to Hawaiians are Celtic ($98,896, a difference of 0.12%), Uruguayan ($98,660, a difference of 0.12%), Kenyan ($98,970, a difference of 0.19%), Spanish ($98,554, a difference of 0.23%), and French Canadian ($99,093, a difference of 0.32%).
| Demographics | Rating | Rank | Householder Income Ages 45 - 64 years |
| Dutch | 41.7 /100 | #186 | Average $99,650 |
| Iraqis | 38.5 /100 | #187 | Fair $99,387 |
| Immigrants | Portugal | 36.3 /100 | #188 | Fair $99,203 |
| Immigrants | South America | 35.4 /100 | #189 | Fair $99,126 |
| French Canadians | 35.1 /100 | #190 | Fair $99,093 |
| Kenyans | 33.7 /100 | #191 | Fair $98,970 |
| Celtics | 32.9 /100 | #192 | Fair $98,896 |
| Hawaiians | 31.6 /100 | #193 | Fair $98,778 |
| Uruguayans | 30.3 /100 | #194 | Fair $98,660 |
| Spanish | 29.2 /100 | #195 | Fair $98,554 |
| Immigrants | Eastern Africa | 28.3 /100 | #196 | Fair $98,467 |
| Puget Sound Salish | 27.0 /100 | #197 | Fair $98,340 |
| Immigrants | Iraq | 25.7 /100 | #198 | Fair $98,201 |
| Whites/Caucasians | 24.6 /100 | #199 | Fair $98,091 |
| Immigrants | Kenya | 23.5 /100 | #200 | Fair $97,964 |