Canadian vs Mexican Median Male Earnings
COMPARE
Canadian
Mexican
Median Male Earnings
Median Male Earnings Comparison
Canadians
Mexicans
$57,286
MEDIAN MALE EARNINGS
93.9/ 100
METRIC RATING
120th/ 347
METRIC RANK
$46,147
MEDIAN MALE EARNINGS
0.0/ 100
METRIC RATING
317th/ 347
METRIC RANK
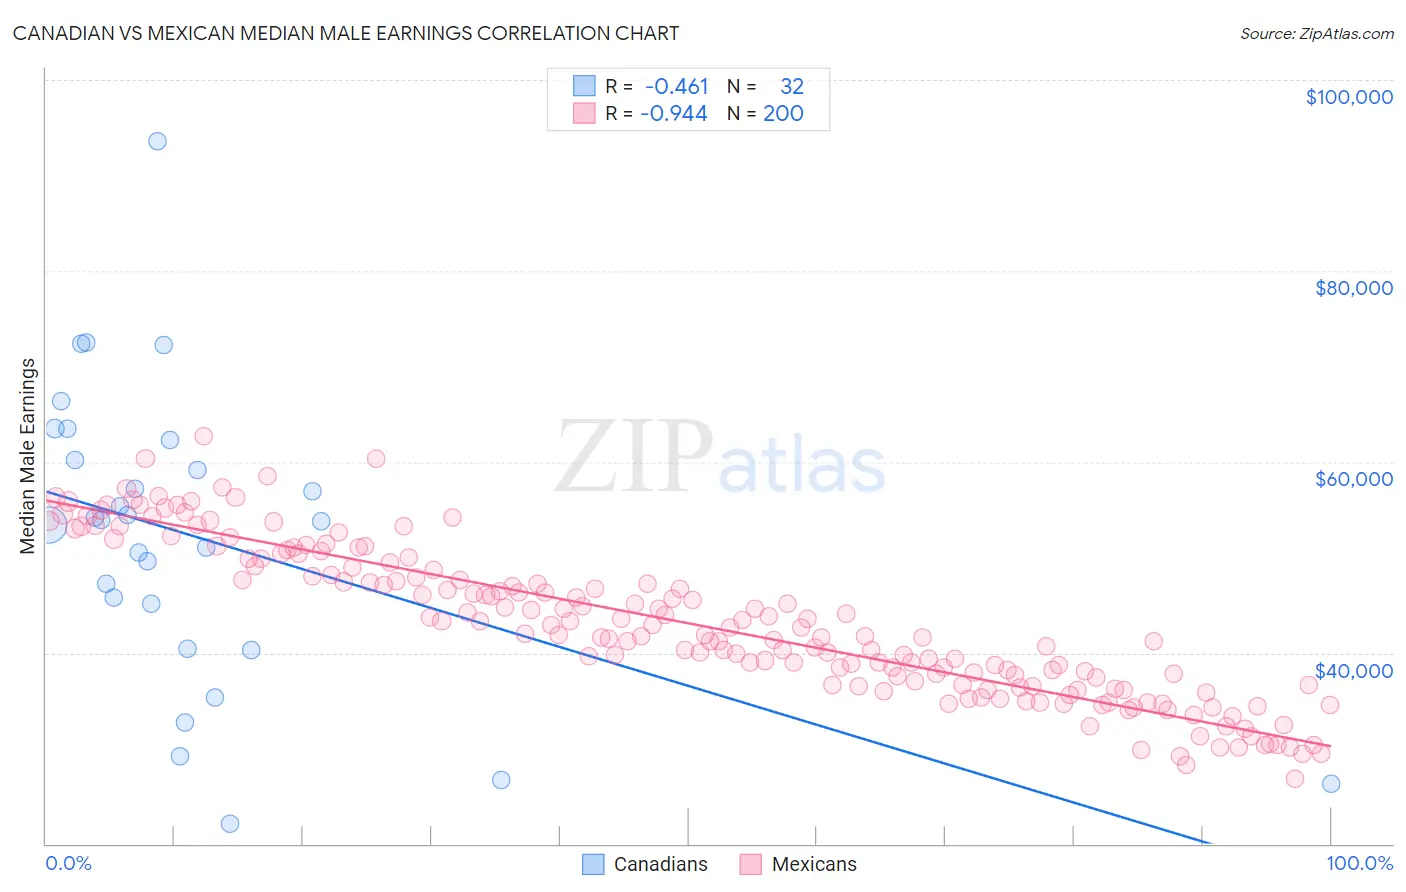
Canadian vs Mexican Median Male Earnings Correlation Chart
The statistical analysis conducted on geographies consisting of 437,343,758 people shows a moderate negative correlation between the proportion of Canadians and median male earnings in the United States with a correlation coefficient (R) of -0.461 and weighted average of $57,286. Similarly, the statistical analysis conducted on geographies consisting of 564,183,218 people shows a near-perfect negative correlation between the proportion of Mexicans and median male earnings in the United States with a correlation coefficient (R) of -0.944 and weighted average of $46,147, a difference of 24.1%.
Median Male Earnings Correlation Summary
| Measurement | Canadian | Mexican |
| Minimum | $22,125 | $26,771 |
| Maximum | $93,638 | $62,671 |
| Range | $71,513 | $35,900 |
| Mean | $52,093 | $43,079 |
| Median | $53,822 | $42,356 |
| Interquartile 25% (IQ1) | $42,789 | $36,668 |
| Interquartile 75% (IQ3) | $61,239 | $48,978 |
| Interquartile Range (IQR) | $18,449 | $12,309 |
| Standard Deviation (Sample) | $15,572 | $7,897 |
| Standard Deviation (Population) | $15,327 | $7,878 |
Similar Demographics by Median Male Earnings
Demographics Similar to Canadians by Median Male Earnings
In terms of median male earnings, the demographic groups most similar to Canadians are Arab ($57,298, a difference of 0.020%), Hungarian ($57,309, a difference of 0.040%), Immigrants from Zimbabwe ($57,352, a difference of 0.12%), Immigrants from Albania ($57,179, a difference of 0.19%), and Lebanese ($57,409, a difference of 0.22%).
| Demographics | Rating | Rank | Median Male Earnings |
| Carpatho Rusyns | 95.3 /100 | #113 | Exceptional $57,572 |
| Immigrants | Kuwait | 95.3 /100 | #114 | Exceptional $57,562 |
| Swedes | 94.8 /100 | #115 | Exceptional $57,445 |
| Lebanese | 94.6 /100 | #116 | Exceptional $57,409 |
| Immigrants | Zimbabwe | 94.3 /100 | #117 | Exceptional $57,352 |
| Hungarians | 94.0 /100 | #118 | Exceptional $57,309 |
| Arabs | 94.0 /100 | #119 | Exceptional $57,298 |
| Canadians | 93.9 /100 | #120 | Exceptional $57,286 |
| Immigrants | Albania | 93.3 /100 | #121 | Exceptional $57,179 |
| Immigrants | Jordan | 93.1 /100 | #122 | Exceptional $57,145 |
| Slovenes | 93.1 /100 | #123 | Exceptional $57,145 |
| Chileans | 91.9 /100 | #124 | Exceptional $56,973 |
| Immigrants | Morocco | 91.8 /100 | #125 | Exceptional $56,958 |
| Chinese | 91.1 /100 | #126 | Exceptional $56,872 |
| Brazilians | 90.9 /100 | #127 | Exceptional $56,837 |
Demographics Similar to Mexicans by Median Male Earnings
In terms of median male earnings, the demographic groups most similar to Mexicans are Immigrants from Caribbean ($46,193, a difference of 0.10%), Cheyenne ($46,062, a difference of 0.18%), Immigrants from Guatemala ($46,244, a difference of 0.21%), Chippewa ($46,368, a difference of 0.48%), and Honduran ($46,374, a difference of 0.49%).
| Demographics | Rating | Rank | Median Male Earnings |
| Cubans | 0.0 /100 | #310 | Tragic $46,580 |
| Apache | 0.0 /100 | #311 | Tragic $46,429 |
| Hispanics or Latinos | 0.0 /100 | #312 | Tragic $46,419 |
| Hondurans | 0.0 /100 | #313 | Tragic $46,374 |
| Chippewa | 0.0 /100 | #314 | Tragic $46,368 |
| Immigrants | Guatemala | 0.0 /100 | #315 | Tragic $46,244 |
| Immigrants | Caribbean | 0.0 /100 | #316 | Tragic $46,193 |
| Mexicans | 0.0 /100 | #317 | Tragic $46,147 |
| Cheyenne | 0.0 /100 | #318 | Tragic $46,062 |
| Haitians | 0.0 /100 | #319 | Tragic $45,903 |
| Immigrants | Honduras | 0.0 /100 | #320 | Tragic $45,787 |
| Fijians | 0.0 /100 | #321 | Tragic $45,607 |
| Sioux | 0.0 /100 | #322 | Tragic $45,566 |
| Immigrants | Central America | 0.0 /100 | #323 | Tragic $45,538 |
| Blacks/African Americans | 0.0 /100 | #324 | Tragic $45,523 |