Canadian vs Zimbabwean Median Male Earnings
COMPARE
Canadian
Zimbabwean
Median Male Earnings
Median Male Earnings Comparison
Canadians
Zimbabweans
$57,286
MEDIAN MALE EARNINGS
93.9/ 100
METRIC RATING
120th/ 347
METRIC RANK
$56,302
MEDIAN MALE EARNINGS
85.5/ 100
METRIC RATING
139th/ 347
METRIC RANK
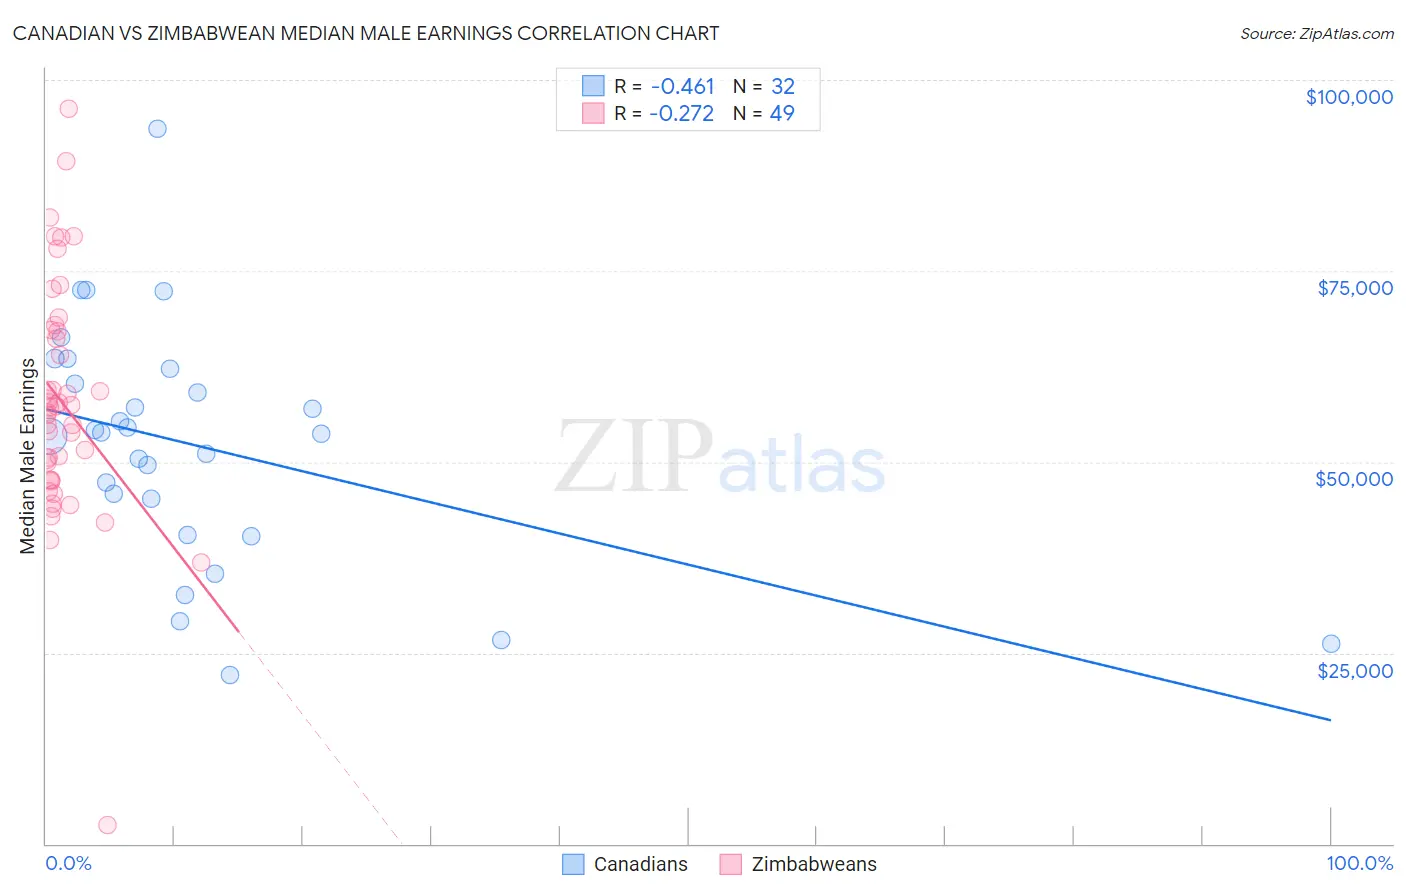
Canadian vs Zimbabwean Median Male Earnings Correlation Chart
The statistical analysis conducted on geographies consisting of 437,343,758 people shows a moderate negative correlation between the proportion of Canadians and median male earnings in the United States with a correlation coefficient (R) of -0.461 and weighted average of $57,286. Similarly, the statistical analysis conducted on geographies consisting of 69,206,147 people shows a weak negative correlation between the proportion of Zimbabweans and median male earnings in the United States with a correlation coefficient (R) of -0.272 and weighted average of $56,302, a difference of 1.8%.
Median Male Earnings Correlation Summary
| Measurement | Canadian | Zimbabwean |
| Minimum | $22,125 | $2,499 |
| Maximum | $93,638 | $96,250 |
| Range | $71,513 | $93,751 |
| Mean | $52,093 | $57,721 |
| Median | $53,822 | $57,093 |
| Interquartile 25% (IQ1) | $42,789 | $47,581 |
| Interquartile 75% (IQ3) | $61,239 | $67,190 |
| Interquartile Range (IQR) | $18,449 | $19,609 |
| Standard Deviation (Sample) | $15,572 | $15,546 |
| Standard Deviation (Population) | $15,327 | $15,387 |
Demographics Similar to Canadians and Zimbabweans by Median Male Earnings
In terms of median male earnings, the demographic groups most similar to Canadians are Arab ($57,298, a difference of 0.020%), Immigrants from Albania ($57,179, a difference of 0.19%), Immigrants from Jordan ($57,145, a difference of 0.25%), Slovene ($57,145, a difference of 0.25%), and Chilean ($56,973, a difference of 0.55%). Similarly, the demographic groups most similar to Zimbabweans are Slovak ($56,306, a difference of 0.010%), Slavic ($56,390, a difference of 0.16%), Immigrants from Saudi Arabia ($56,452, a difference of 0.27%), Irish ($56,464, a difference of 0.29%), and Moroccan ($56,499, a difference of 0.35%).
| Demographics | Rating | Rank | Median Male Earnings |
| Arabs | 94.0 /100 | #119 | Exceptional $57,298 |
| Canadians | 93.9 /100 | #120 | Exceptional $57,286 |
| Immigrants | Albania | 93.3 /100 | #121 | Exceptional $57,179 |
| Immigrants | Jordan | 93.1 /100 | #122 | Exceptional $57,145 |
| Slovenes | 93.1 /100 | #123 | Exceptional $57,145 |
| Chileans | 91.9 /100 | #124 | Exceptional $56,973 |
| Immigrants | Morocco | 91.8 /100 | #125 | Exceptional $56,958 |
| Chinese | 91.1 /100 | #126 | Exceptional $56,872 |
| Brazilians | 90.9 /100 | #127 | Exceptional $56,837 |
| Immigrants | Syria | 90.8 /100 | #128 | Exceptional $56,830 |
| Pakistanis | 89.9 /100 | #129 | Excellent $56,719 |
| Koreans | 89.4 /100 | #130 | Excellent $56,672 |
| Portuguese | 89.4 /100 | #131 | Excellent $56,663 |
| Czechs | 88.2 /100 | #132 | Excellent $56,546 |
| Immigrants | Germany | 88.2 /100 | #133 | Excellent $56,542 |
| Moroccans | 87.7 /100 | #134 | Excellent $56,499 |
| Irish | 87.4 /100 | #135 | Excellent $56,464 |
| Immigrants | Saudi Arabia | 87.2 /100 | #136 | Excellent $56,452 |
| Slavs | 86.5 /100 | #137 | Excellent $56,390 |
| Slovaks | 85.5 /100 | #138 | Excellent $56,306 |
| Zimbabweans | 85.5 /100 | #139 | Excellent $56,302 |