Immigrants from Western Africa vs Mexican Median Male Earnings
COMPARE
Immigrants from Western Africa
Mexican
Median Male Earnings
Median Male Earnings Comparison
Immigrants from Western Africa
Mexicans
$50,940
MEDIAN MALE EARNINGS
3.0/ 100
METRIC RATING
235th/ 347
METRIC RANK
$46,147
MEDIAN MALE EARNINGS
0.0/ 100
METRIC RATING
317th/ 347
METRIC RANK
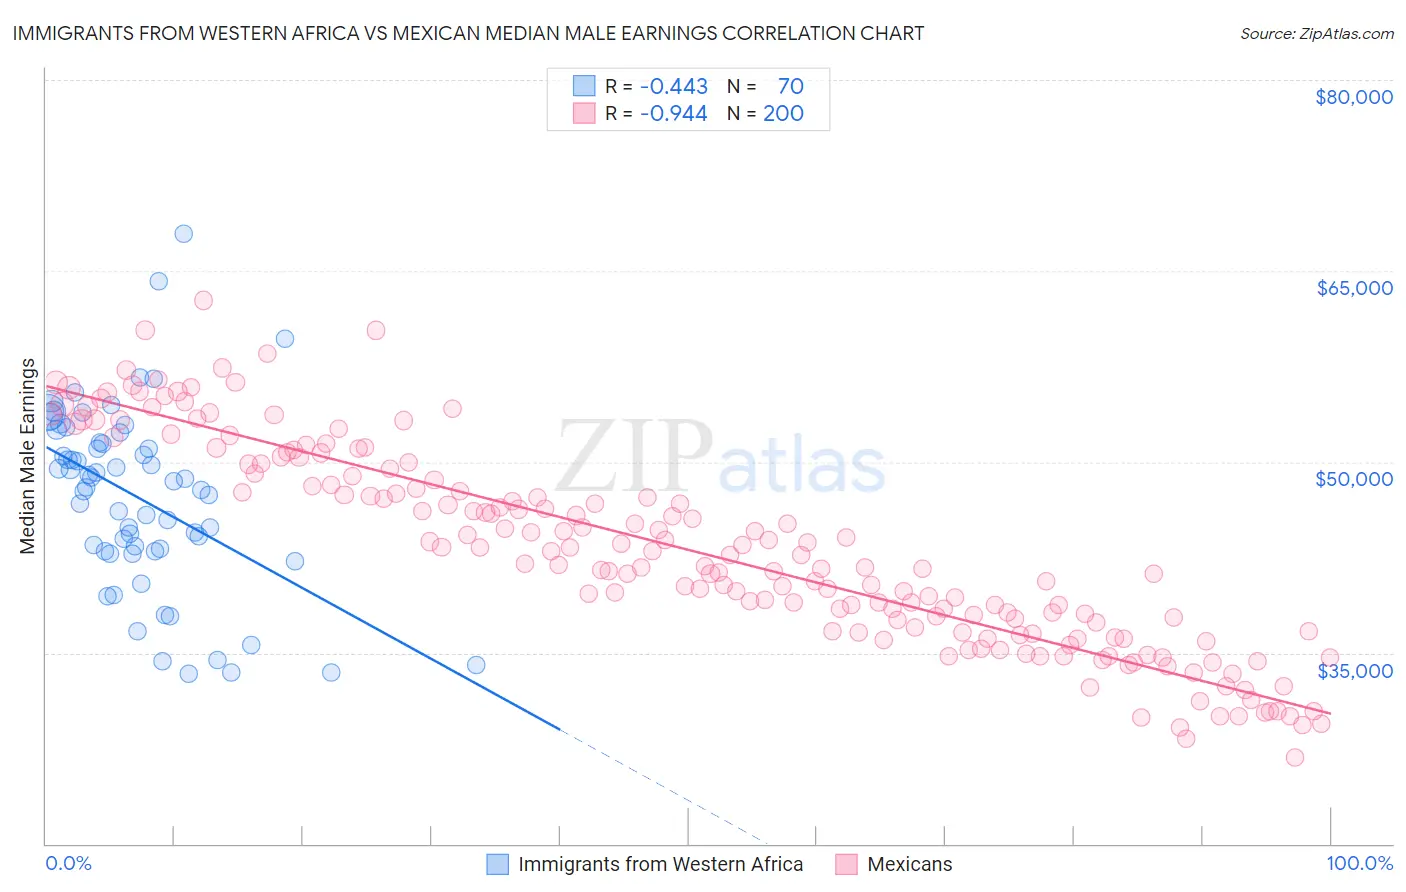
Immigrants from Western Africa vs Mexican Median Male Earnings Correlation Chart
The statistical analysis conducted on geographies consisting of 357,835,205 people shows a moderate negative correlation between the proportion of Immigrants from Western Africa and median male earnings in the United States with a correlation coefficient (R) of -0.443 and weighted average of $50,940. Similarly, the statistical analysis conducted on geographies consisting of 564,183,218 people shows a near-perfect negative correlation between the proportion of Mexicans and median male earnings in the United States with a correlation coefficient (R) of -0.944 and weighted average of $46,147, a difference of 10.4%.
Median Male Earnings Correlation Summary
| Measurement | Immigrants from Western Africa | Mexican |
| Minimum | $33,371 | $26,771 |
| Maximum | $67,960 | $62,671 |
| Range | $34,589 | $35,900 |
| Mean | $47,183 | $43,079 |
| Median | $48,227 | $42,356 |
| Interquartile 25% (IQ1) | $42,968 | $36,668 |
| Interquartile 75% (IQ3) | $51,502 | $48,978 |
| Interquartile Range (IQR) | $8,534 | $12,309 |
| Standard Deviation (Sample) | $7,172 | $7,897 |
| Standard Deviation (Population) | $7,120 | $7,878 |
Similar Demographics by Median Male Earnings
Demographics Similar to Immigrants from Western Africa by Median Male Earnings
In terms of median male earnings, the demographic groups most similar to Immigrants from Western Africa are Pennsylvania German ($50,878, a difference of 0.12%), Immigrants from Barbados ($50,795, a difference of 0.28%), Cape Verdean ($51,103, a difference of 0.32%), Malaysian ($50,772, a difference of 0.33%), and American ($50,761, a difference of 0.35%).
| Demographics | Rating | Rank | Median Male Earnings |
| Samoans | 4.6 /100 | #228 | Tragic $51,389 |
| Immigrants | Trinidad and Tobago | 4.5 /100 | #229 | Tragic $51,376 |
| Immigrants | Nigeria | 4.2 /100 | #230 | Tragic $51,310 |
| Barbadians | 3.9 /100 | #231 | Tragic $51,236 |
| Sudanese | 3.9 /100 | #232 | Tragic $51,216 |
| Aleuts | 3.7 /100 | #233 | Tragic $51,168 |
| Cape Verdeans | 3.5 /100 | #234 | Tragic $51,103 |
| Immigrants | Western Africa | 3.0 /100 | #235 | Tragic $50,940 |
| Pennsylvania Germans | 2.8 /100 | #236 | Tragic $50,878 |
| Immigrants | Barbados | 2.6 /100 | #237 | Tragic $50,795 |
| Malaysians | 2.5 /100 | #238 | Tragic $50,772 |
| Americans | 2.5 /100 | #239 | Tragic $50,761 |
| West Indians | 2.3 /100 | #240 | Tragic $50,682 |
| Immigrants | St. Vincent and the Grenadines | 2.3 /100 | #241 | Tragic $50,665 |
| Guyanese | 2.2 /100 | #242 | Tragic $50,613 |
Demographics Similar to Mexicans by Median Male Earnings
In terms of median male earnings, the demographic groups most similar to Mexicans are Immigrants from Caribbean ($46,193, a difference of 0.10%), Cheyenne ($46,062, a difference of 0.18%), Immigrants from Guatemala ($46,244, a difference of 0.21%), Chippewa ($46,368, a difference of 0.48%), and Honduran ($46,374, a difference of 0.49%).
| Demographics | Rating | Rank | Median Male Earnings |
| Cubans | 0.0 /100 | #310 | Tragic $46,580 |
| Apache | 0.0 /100 | #311 | Tragic $46,429 |
| Hispanics or Latinos | 0.0 /100 | #312 | Tragic $46,419 |
| Hondurans | 0.0 /100 | #313 | Tragic $46,374 |
| Chippewa | 0.0 /100 | #314 | Tragic $46,368 |
| Immigrants | Guatemala | 0.0 /100 | #315 | Tragic $46,244 |
| Immigrants | Caribbean | 0.0 /100 | #316 | Tragic $46,193 |
| Mexicans | 0.0 /100 | #317 | Tragic $46,147 |
| Cheyenne | 0.0 /100 | #318 | Tragic $46,062 |
| Haitians | 0.0 /100 | #319 | Tragic $45,903 |
| Immigrants | Honduras | 0.0 /100 | #320 | Tragic $45,787 |
| Fijians | 0.0 /100 | #321 | Tragic $45,607 |
| Sioux | 0.0 /100 | #322 | Tragic $45,566 |
| Immigrants | Central America | 0.0 /100 | #323 | Tragic $45,538 |
| Blacks/African Americans | 0.0 /100 | #324 | Tragic $45,523 |