Canadian vs Immigrants from Albania Median Male Earnings
COMPARE
Canadian
Immigrants from Albania
Median Male Earnings
Median Male Earnings Comparison
Canadians
Immigrants from Albania
$57,286
MEDIAN MALE EARNINGS
93.9/ 100
METRIC RATING
120th/ 347
METRIC RANK
$57,179
MEDIAN MALE EARNINGS
93.3/ 100
METRIC RATING
121st/ 347
METRIC RANK
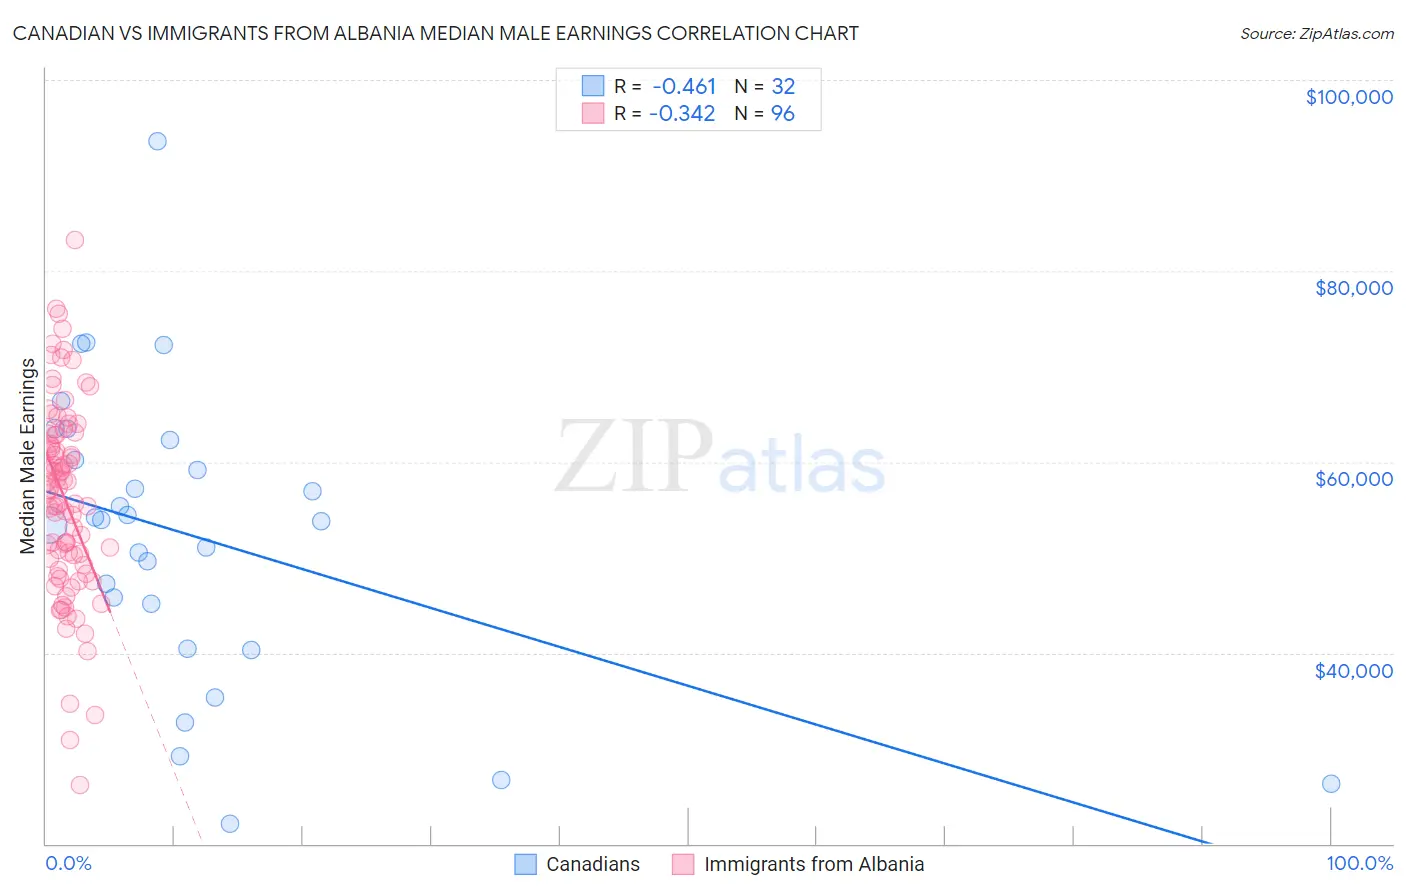
Canadian vs Immigrants from Albania Median Male Earnings Correlation Chart
The statistical analysis conducted on geographies consisting of 437,343,758 people shows a moderate negative correlation between the proportion of Canadians and median male earnings in the United States with a correlation coefficient (R) of -0.461 and weighted average of $57,286. Similarly, the statistical analysis conducted on geographies consisting of 119,358,930 people shows a mild negative correlation between the proportion of Immigrants from Albania and median male earnings in the United States with a correlation coefficient (R) of -0.342 and weighted average of $57,179, a difference of 0.19%.
Median Male Earnings Correlation Summary
| Measurement | Canadian | Immigrants from Albania |
| Minimum | $22,125 | $26,127 |
| Maximum | $93,638 | $83,209 |
| Range | $71,513 | $57,082 |
| Mean | $52,093 | $56,160 |
| Median | $53,822 | $57,139 |
| Interquartile 25% (IQ1) | $42,789 | $49,475 |
| Interquartile 75% (IQ3) | $61,239 | $62,806 |
| Interquartile Range (IQR) | $18,449 | $13,331 |
| Standard Deviation (Sample) | $15,572 | $10,176 |
| Standard Deviation (Population) | $15,327 | $10,123 |
Demographics Similar to Canadians and Immigrants from Albania by Median Male Earnings
In terms of median male earnings, the demographic groups most similar to Canadians are Arab ($57,298, a difference of 0.020%), Hungarian ($57,309, a difference of 0.040%), Immigrants from Zimbabwe ($57,352, a difference of 0.12%), Lebanese ($57,409, a difference of 0.22%), and Immigrants from Jordan ($57,145, a difference of 0.25%). Similarly, the demographic groups most similar to Immigrants from Albania are Immigrants from Jordan ($57,145, a difference of 0.060%), Slovene ($57,145, a difference of 0.060%), Arab ($57,298, a difference of 0.21%), Hungarian ($57,309, a difference of 0.23%), and Immigrants from Zimbabwe ($57,352, a difference of 0.30%).
| Demographics | Rating | Rank | Median Male Earnings |
| Palestinians | 96.2 /100 | #110 | Exceptional $57,778 |
| Europeans | 95.6 /100 | #111 | Exceptional $57,637 |
| Immigrants | Afghanistan | 95.4 /100 | #112 | Exceptional $57,582 |
| Carpatho Rusyns | 95.3 /100 | #113 | Exceptional $57,572 |
| Immigrants | Kuwait | 95.3 /100 | #114 | Exceptional $57,562 |
| Swedes | 94.8 /100 | #115 | Exceptional $57,445 |
| Lebanese | 94.6 /100 | #116 | Exceptional $57,409 |
| Immigrants | Zimbabwe | 94.3 /100 | #117 | Exceptional $57,352 |
| Hungarians | 94.0 /100 | #118 | Exceptional $57,309 |
| Arabs | 94.0 /100 | #119 | Exceptional $57,298 |
| Canadians | 93.9 /100 | #120 | Exceptional $57,286 |
| Immigrants | Albania | 93.3 /100 | #121 | Exceptional $57,179 |
| Immigrants | Jordan | 93.1 /100 | #122 | Exceptional $57,145 |
| Slovenes | 93.1 /100 | #123 | Exceptional $57,145 |
| Chileans | 91.9 /100 | #124 | Exceptional $56,973 |
| Immigrants | Morocco | 91.8 /100 | #125 | Exceptional $56,958 |
| Chinese | 91.1 /100 | #126 | Exceptional $56,872 |
| Brazilians | 90.9 /100 | #127 | Exceptional $56,837 |
| Immigrants | Syria | 90.8 /100 | #128 | Exceptional $56,830 |
| Pakistanis | 89.9 /100 | #129 | Excellent $56,719 |
| Koreans | 89.4 /100 | #130 | Excellent $56,672 |