Canadian vs European Median Male Earnings
COMPARE
Canadian
European
Median Male Earnings
Median Male Earnings Comparison
Canadians
Europeans
$57,286
MEDIAN MALE EARNINGS
93.9/ 100
METRIC RATING
120th/ 347
METRIC RANK
$57,637
MEDIAN MALE EARNINGS
95.6/ 100
METRIC RATING
111th/ 347
METRIC RANK
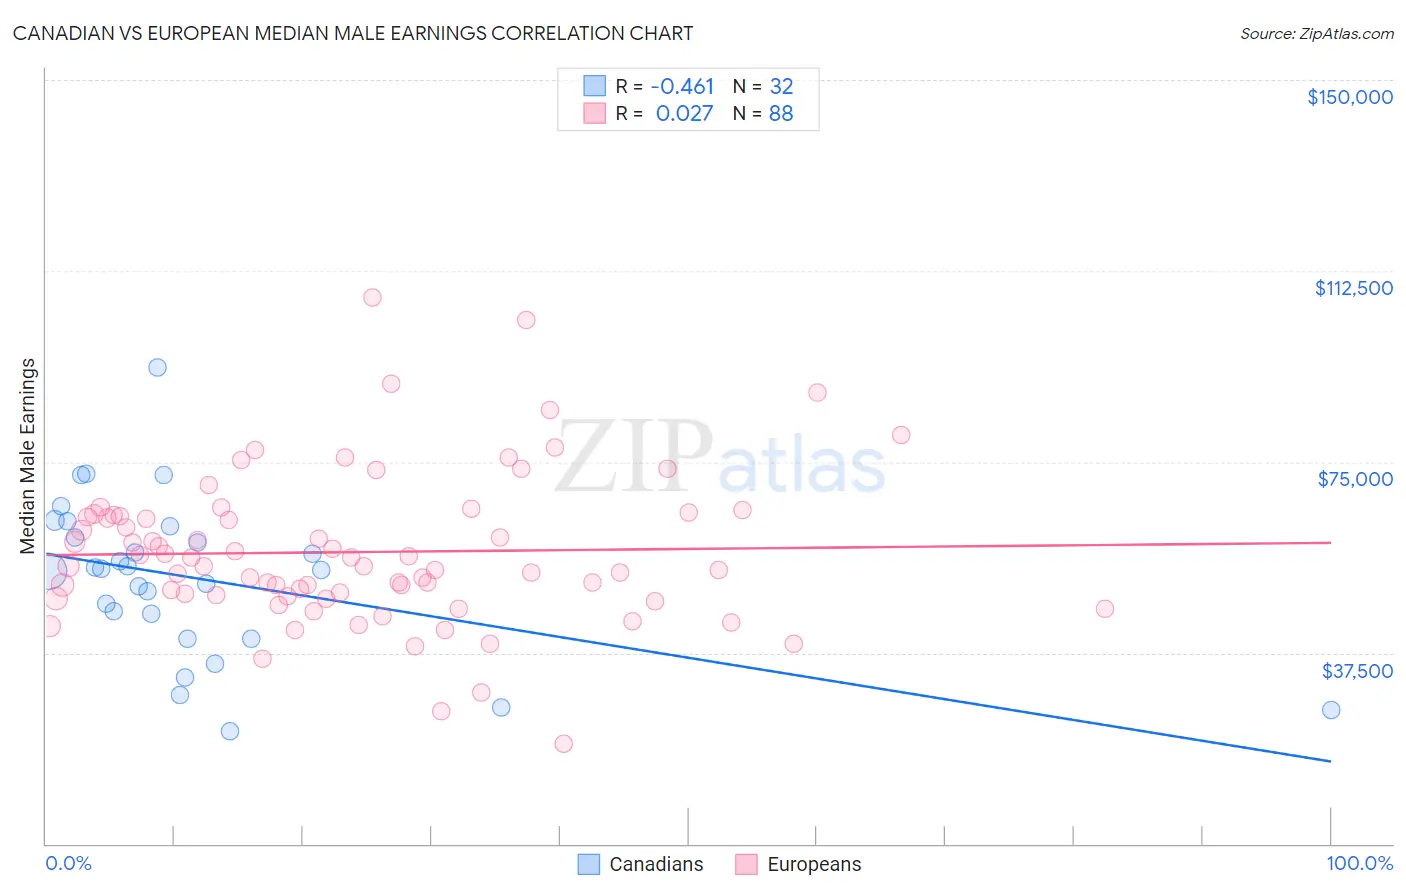
Canadian vs European Median Male Earnings Correlation Chart
The statistical analysis conducted on geographies consisting of 437,343,758 people shows a moderate negative correlation between the proportion of Canadians and median male earnings in the United States with a correlation coefficient (R) of -0.461 and weighted average of $57,286. Similarly, the statistical analysis conducted on geographies consisting of 560,846,229 people shows no correlation between the proportion of Europeans and median male earnings in the United States with a correlation coefficient (R) of 0.027 and weighted average of $57,637, a difference of 0.61%.
Median Male Earnings Correlation Summary
| Measurement | Canadian | European |
| Minimum | $22,125 | $19,583 |
| Maximum | $93,638 | $107,377 |
| Range | $71,513 | $87,794 |
| Mean | $52,093 | $57,294 |
| Median | $53,822 | $54,588 |
| Interquartile 25% (IQ1) | $42,789 | $48,703 |
| Interquartile 75% (IQ3) | $61,239 | $64,440 |
| Interquartile Range (IQR) | $18,449 | $15,737 |
| Standard Deviation (Sample) | $15,572 | $14,840 |
| Standard Deviation (Population) | $15,327 | $14,755 |
Demographics Similar to Canadians and Europeans by Median Male Earnings
In terms of median male earnings, the demographic groups most similar to Canadians are Arab ($57,298, a difference of 0.020%), Hungarian ($57,309, a difference of 0.040%), Immigrants from Zimbabwe ($57,352, a difference of 0.12%), Immigrants from Albania ($57,179, a difference of 0.19%), and Lebanese ($57,409, a difference of 0.22%). Similarly, the demographic groups most similar to Europeans are Immigrants from Afghanistan ($57,582, a difference of 0.090%), Carpatho Rusyn ($57,572, a difference of 0.11%), Immigrants from Kuwait ($57,562, a difference of 0.13%), Palestinian ($57,778, a difference of 0.25%), and Swedish ($57,445, a difference of 0.33%).
| Demographics | Rating | Rank | Median Male Earnings |
| Immigrants | Western Asia | 97.3 /100 | #105 | Exceptional $58,131 |
| Immigrants | Northern Africa | 96.9 /100 | #106 | Exceptional $58,008 |
| Serbians | 96.8 /100 | #107 | Exceptional $57,975 |
| Immigrants | Uzbekistan | 96.7 /100 | #108 | Exceptional $57,941 |
| British | 96.5 /100 | #109 | Exceptional $57,890 |
| Palestinians | 96.2 /100 | #110 | Exceptional $57,778 |
| Europeans | 95.6 /100 | #111 | Exceptional $57,637 |
| Immigrants | Afghanistan | 95.4 /100 | #112 | Exceptional $57,582 |
| Carpatho Rusyns | 95.3 /100 | #113 | Exceptional $57,572 |
| Immigrants | Kuwait | 95.3 /100 | #114 | Exceptional $57,562 |
| Swedes | 94.8 /100 | #115 | Exceptional $57,445 |
| Lebanese | 94.6 /100 | #116 | Exceptional $57,409 |
| Immigrants | Zimbabwe | 94.3 /100 | #117 | Exceptional $57,352 |
| Hungarians | 94.0 /100 | #118 | Exceptional $57,309 |
| Arabs | 94.0 /100 | #119 | Exceptional $57,298 |
| Canadians | 93.9 /100 | #120 | Exceptional $57,286 |
| Immigrants | Albania | 93.3 /100 | #121 | Exceptional $57,179 |
| Immigrants | Jordan | 93.1 /100 | #122 | Exceptional $57,145 |
| Slovenes | 93.1 /100 | #123 | Exceptional $57,145 |
| Chileans | 91.9 /100 | #124 | Exceptional $56,973 |
| Immigrants | Morocco | 91.8 /100 | #125 | Exceptional $56,958 |