Canadian vs Alaskan Athabascan Householder Income Under 25 years
COMPARE
Canadian
Alaskan Athabascan
Householder Income Under 25 years
Householder Income Under 25 years Comparison
Canadians
Alaskan Athabascans
$52,336
HOUSEHOLDER INCOME UNDER 25 YEARS
58.8/ 100
METRIC RATING
169th/ 347
METRIC RANK
$51,713
HOUSEHOLDER INCOME UNDER 25 YEARS
23.8/ 100
METRIC RATING
186th/ 347
METRIC RANK
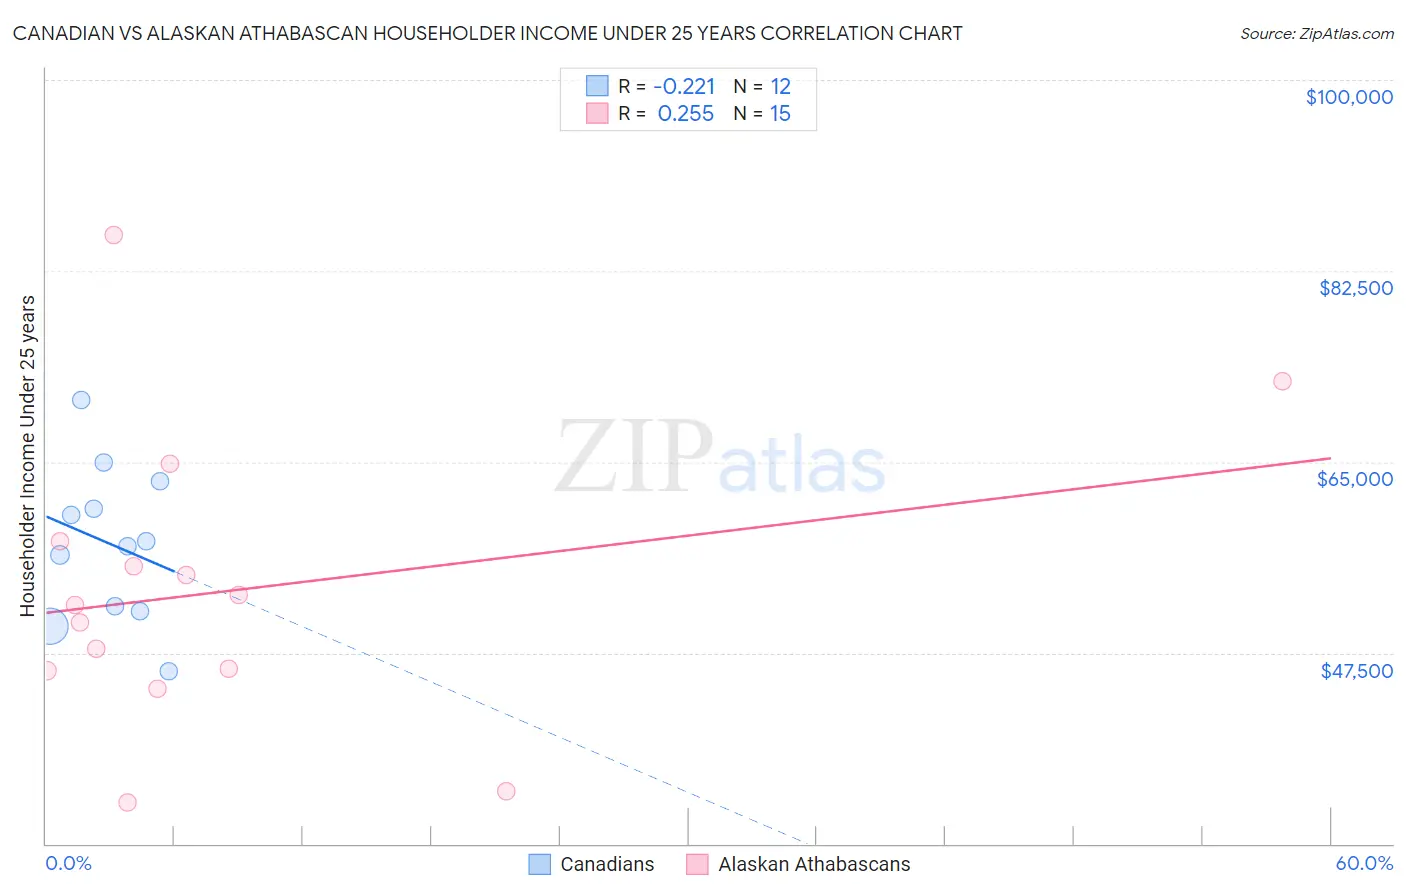
Canadian vs Alaskan Athabascan Householder Income Under 25 years Correlation Chart
The statistical analysis conducted on geographies consisting of 362,146,468 people shows a weak negative correlation between the proportion of Canadians and household income with householder under the age of 25 in the United States with a correlation coefficient (R) of -0.221 and weighted average of $52,336. Similarly, the statistical analysis conducted on geographies consisting of 43,356,340 people shows a weak positive correlation between the proportion of Alaskan Athabascans and household income with householder under the age of 25 in the United States with a correlation coefficient (R) of 0.255 and weighted average of $51,713, a difference of 1.2%.
Householder Income Under 25 years Correlation Summary
| Measurement | Canadian | Alaskan Athabascan |
| Minimum | $45,833 | $33,750 |
| Maximum | $70,623 | $85,791 |
| Range | $24,790 | $52,041 |
| Mean | $57,498 | $53,228 |
| Median | $57,522 | $51,876 |
| Interquartile 25% (IQ1) | $51,515 | $45,858 |
| Interquartile 75% (IQ3) | $61,958 | $57,780 |
| Interquartile Range (IQR) | $10,443 | $11,922 |
| Standard Deviation (Sample) | $7,030 | $13,457 |
| Standard Deviation (Population) | $6,730 | $13,000 |
Demographics Similar to Canadians and Alaskan Athabascans by Householder Income Under 25 years
In terms of householder income under 25 years, the demographic groups most similar to Canadians are Israeli ($52,335, a difference of 0.0%), Japanese ($52,365, a difference of 0.060%), Immigrants from Uganda ($52,374, a difference of 0.070%), Immigrants from Uruguay ($52,302, a difference of 0.070%), and Cypriot ($52,209, a difference of 0.24%). Similarly, the demographic groups most similar to Alaskan Athabascans are Immigrants from South Africa ($51,705, a difference of 0.020%), Immigrants from Latvia ($51,737, a difference of 0.050%), Paiute ($51,743, a difference of 0.060%), Mexican American Indian ($51,783, a difference of 0.13%), and European ($51,796, a difference of 0.16%).
| Demographics | Rating | Rank | Householder Income Under 25 years |
| Immigrants | Uganda | 61.1 /100 | #167 | Good $52,374 |
| Japanese | 60.5 /100 | #168 | Good $52,365 |
| Canadians | 58.8 /100 | #169 | Average $52,336 |
| Israelis | 58.8 /100 | #170 | Average $52,335 |
| Immigrants | Uruguay | 56.8 /100 | #171 | Average $52,302 |
| Cypriots | 51.2 /100 | #172 | Average $52,209 |
| Barbadians | 50.8 /100 | #173 | Average $52,202 |
| Immigrants | Western Asia | 50.0 /100 | #174 | Average $52,190 |
| Immigrants | Zimbabwe | 33.8 /100 | #175 | Fair $51,914 |
| Austrians | 32.9 /100 | #176 | Fair $51,898 |
| British West Indians | 30.0 /100 | #177 | Fair $51,844 |
| Finns | 29.2 /100 | #178 | Fair $51,827 |
| Basques | 28.7 /100 | #179 | Fair $51,818 |
| Immigrants | England | 28.7 /100 | #180 | Fair $51,817 |
| Europeans | 27.6 /100 | #181 | Fair $51,796 |
| Jordanians | 27.6 /100 | #182 | Fair $51,796 |
| Mexican American Indians | 27.0 /100 | #183 | Fair $51,783 |
| Paiute | 25.1 /100 | #184 | Fair $51,743 |
| Immigrants | Latvia | 24.8 /100 | #185 | Fair $51,737 |
| Alaskan Athabascans | 23.8 /100 | #186 | Fair $51,713 |
| Immigrants | South Africa | 23.4 /100 | #187 | Fair $51,705 |