Immigrants from Austria vs Alaskan Athabascan Householder Income Under 25 years
COMPARE
Immigrants from Austria
Alaskan Athabascan
Householder Income Under 25 years
Householder Income Under 25 years Comparison
Immigrants from Austria
Alaskan Athabascans
$52,400
HOUSEHOLDER INCOME UNDER 25 YEARS
62.6/ 100
METRIC RATING
166th/ 347
METRIC RANK
$51,713
HOUSEHOLDER INCOME UNDER 25 YEARS
23.8/ 100
METRIC RATING
186th/ 347
METRIC RANK
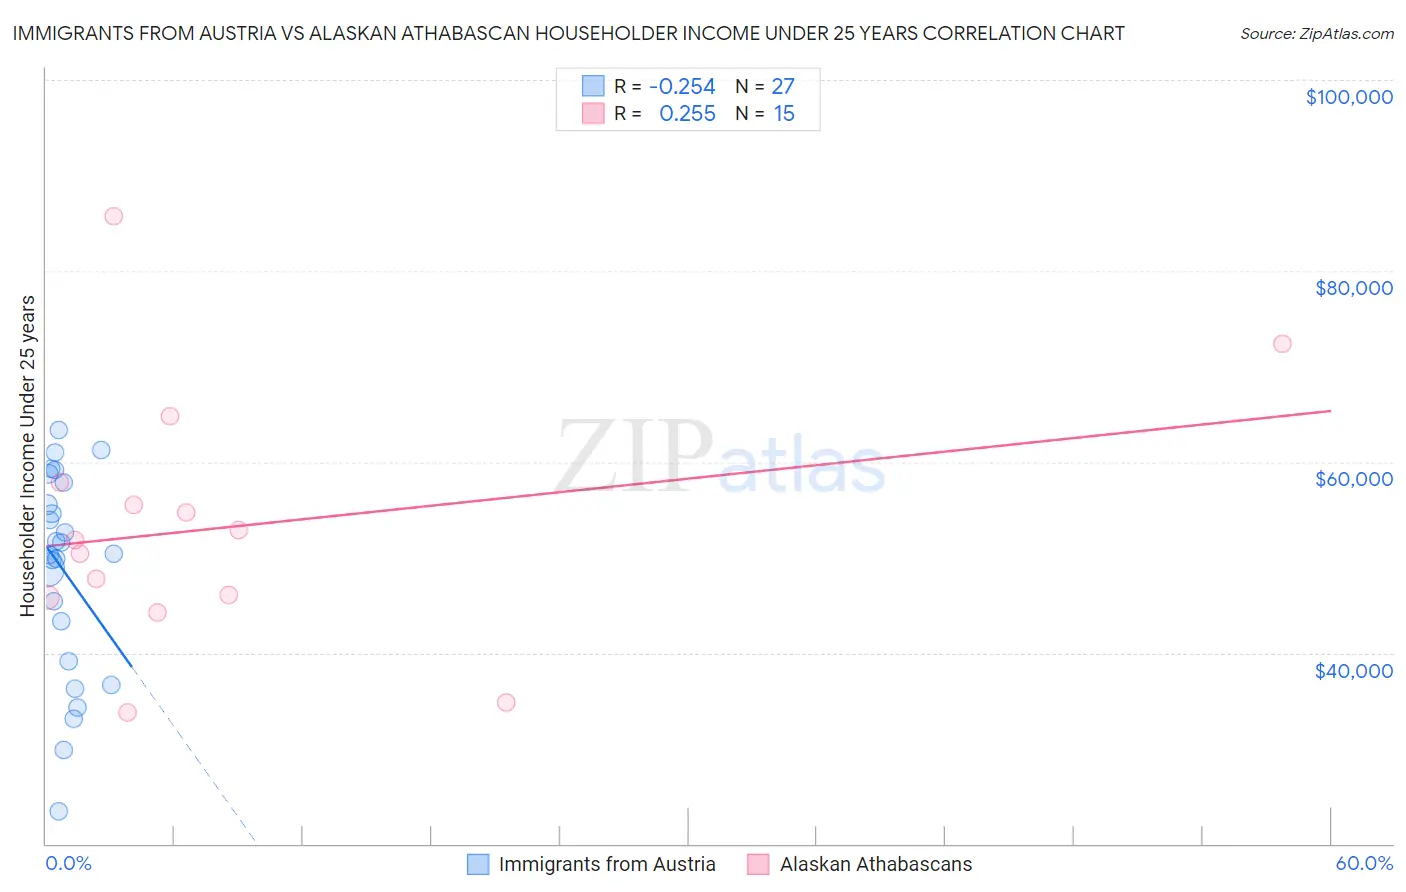
Immigrants from Austria vs Alaskan Athabascan Householder Income Under 25 years Correlation Chart
The statistical analysis conducted on geographies consisting of 148,326,124 people shows a weak negative correlation between the proportion of Immigrants from Austria and household income with householder under the age of 25 in the United States with a correlation coefficient (R) of -0.254 and weighted average of $52,400. Similarly, the statistical analysis conducted on geographies consisting of 43,356,340 people shows a weak positive correlation between the proportion of Alaskan Athabascans and household income with householder under the age of 25 in the United States with a correlation coefficient (R) of 0.255 and weighted average of $51,713, a difference of 1.3%.
Householder Income Under 25 years Correlation Summary
| Measurement | Immigrants from Austria | Alaskan Athabascan |
| Minimum | $23,462 | $33,750 |
| Maximum | $63,282 | $85,791 |
| Range | $39,820 | $52,041 |
| Mean | $48,547 | $53,228 |
| Median | $50,350 | $51,876 |
| Interquartile 25% (IQ1) | $39,087 | $45,858 |
| Interquartile 75% (IQ3) | $57,875 | $57,780 |
| Interquartile Range (IQR) | $18,788 | $11,922 |
| Standard Deviation (Sample) | $10,655 | $13,457 |
| Standard Deviation (Population) | $10,456 | $13,000 |
Demographics Similar to Immigrants from Austria and Alaskan Athabascans by Householder Income Under 25 years
In terms of householder income under 25 years, the demographic groups most similar to Immigrants from Austria are Immigrants from Uganda ($52,374, a difference of 0.050%), Japanese ($52,365, a difference of 0.070%), Canadian ($52,336, a difference of 0.12%), Israeli ($52,335, a difference of 0.12%), and Immigrants from Uruguay ($52,302, a difference of 0.19%). Similarly, the demographic groups most similar to Alaskan Athabascans are Immigrants from Latvia ($51,737, a difference of 0.050%), Paiute ($51,743, a difference of 0.060%), Mexican American Indian ($51,783, a difference of 0.13%), European ($51,796, a difference of 0.16%), and Jordanian ($51,796, a difference of 0.16%).
| Demographics | Rating | Rank | Householder Income Under 25 years |
| Immigrants | Austria | 62.6 /100 | #166 | Good $52,400 |
| Immigrants | Uganda | 61.1 /100 | #167 | Good $52,374 |
| Japanese | 60.5 /100 | #168 | Good $52,365 |
| Canadians | 58.8 /100 | #169 | Average $52,336 |
| Israelis | 58.8 /100 | #170 | Average $52,335 |
| Immigrants | Uruguay | 56.8 /100 | #171 | Average $52,302 |
| Cypriots | 51.2 /100 | #172 | Average $52,209 |
| Barbadians | 50.8 /100 | #173 | Average $52,202 |
| Immigrants | Western Asia | 50.0 /100 | #174 | Average $52,190 |
| Immigrants | Zimbabwe | 33.8 /100 | #175 | Fair $51,914 |
| Austrians | 32.9 /100 | #176 | Fair $51,898 |
| British West Indians | 30.0 /100 | #177 | Fair $51,844 |
| Finns | 29.2 /100 | #178 | Fair $51,827 |
| Basques | 28.7 /100 | #179 | Fair $51,818 |
| Immigrants | England | 28.7 /100 | #180 | Fair $51,817 |
| Europeans | 27.6 /100 | #181 | Fair $51,796 |
| Jordanians | 27.6 /100 | #182 | Fair $51,796 |
| Mexican American Indians | 27.0 /100 | #183 | Fair $51,783 |
| Paiute | 25.1 /100 | #184 | Fair $51,743 |
| Immigrants | Latvia | 24.8 /100 | #185 | Fair $51,737 |
| Alaskan Athabascans | 23.8 /100 | #186 | Fair $51,713 |