Immigrants from Southern Europe vs Alaskan Athabascan Householder Income Under 25 years
COMPARE
Immigrants from Southern Europe
Alaskan Athabascan
Householder Income Under 25 years
Householder Income Under 25 years Comparison
Immigrants from Southern Europe
Alaskan Athabascans
$54,484
HOUSEHOLDER INCOME UNDER 25 YEARS
99.6/ 100
METRIC RATING
77th/ 347
METRIC RANK
$51,713
HOUSEHOLDER INCOME UNDER 25 YEARS
23.8/ 100
METRIC RATING
186th/ 347
METRIC RANK
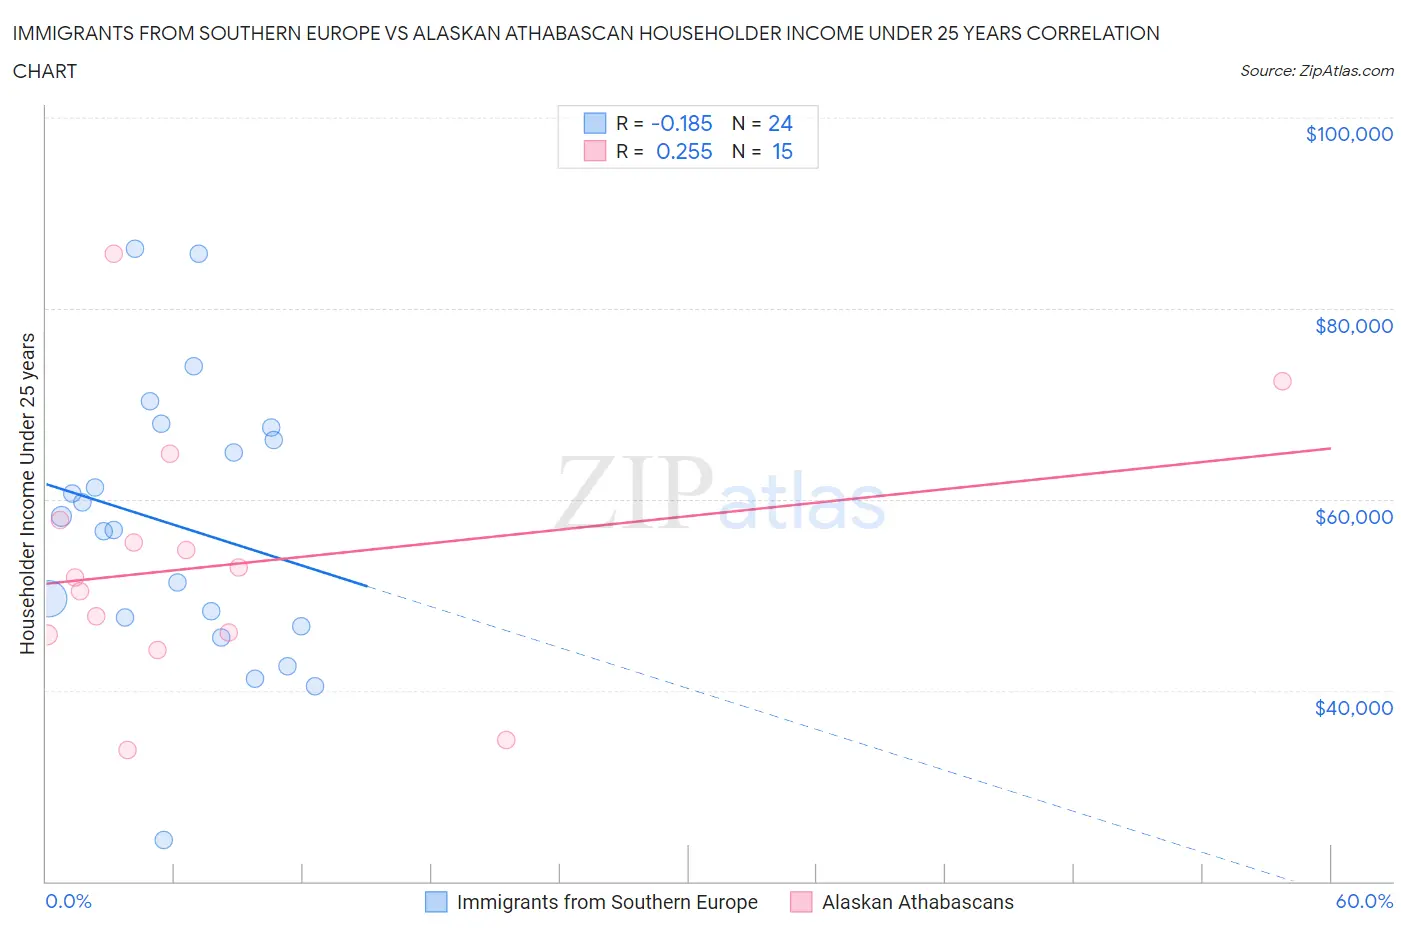
Immigrants from Southern Europe vs Alaskan Athabascan Householder Income Under 25 years Correlation Chart
The statistical analysis conducted on geographies consisting of 332,779,485 people shows a poor negative correlation between the proportion of Immigrants from Southern Europe and household income with householder under the age of 25 in the United States with a correlation coefficient (R) of -0.185 and weighted average of $54,484. Similarly, the statistical analysis conducted on geographies consisting of 43,356,340 people shows a weak positive correlation between the proportion of Alaskan Athabascans and household income with householder under the age of 25 in the United States with a correlation coefficient (R) of 0.255 and weighted average of $51,713, a difference of 5.4%.
Householder Income Under 25 years Correlation Summary
| Measurement | Immigrants from Southern Europe | Alaskan Athabascan |
| Minimum | $24,293 | $33,750 |
| Maximum | $86,315 | $85,791 |
| Range | $62,022 | $52,041 |
| Mean | $57,230 | $53,228 |
| Median | $57,501 | $51,876 |
| Interquartile 25% (IQ1) | $47,158 | $45,858 |
| Interquartile 75% (IQ3) | $66,842 | $57,780 |
| Interquartile Range (IQR) | $19,684 | $11,922 |
| Standard Deviation (Sample) | $14,522 | $13,457 |
| Standard Deviation (Population) | $14,216 | $13,000 |
Similar Demographics by Householder Income Under 25 years
Demographics Similar to Immigrants from Southern Europe by Householder Income Under 25 years
In terms of householder income under 25 years, the demographic groups most similar to Immigrants from Southern Europe are Immigrants from Brazil ($54,487, a difference of 0.010%), Nepalese ($54,472, a difference of 0.020%), Immigrants from Sri Lanka ($54,512, a difference of 0.050%), Immigrants from Italy ($54,449, a difference of 0.060%), and Egyptian ($54,444, a difference of 0.070%).
| Demographics | Rating | Rank | Householder Income Under 25 years |
| Immigrants | El Salvador | 99.7 /100 | #70 | Exceptional $54,599 |
| Immigrants | Morocco | 99.7 /100 | #71 | Exceptional $54,593 |
| Immigrants | Northern Europe | 99.7 /100 | #72 | Exceptional $54,571 |
| Macedonians | 99.7 /100 | #73 | Exceptional $54,563 |
| Immigrants | Grenada | 99.7 /100 | #74 | Exceptional $54,538 |
| Immigrants | Sri Lanka | 99.7 /100 | #75 | Exceptional $54,512 |
| Immigrants | Brazil | 99.6 /100 | #76 | Exceptional $54,487 |
| Immigrants | Southern Europe | 99.6 /100 | #77 | Exceptional $54,484 |
| Nepalese | 99.6 /100 | #78 | Exceptional $54,472 |
| Immigrants | Italy | 99.6 /100 | #79 | Exceptional $54,449 |
| Egyptians | 99.6 /100 | #80 | Exceptional $54,444 |
| Portuguese | 99.6 /100 | #81 | Exceptional $54,436 |
| Russians | 99.5 /100 | #82 | Exceptional $54,389 |
| Laotians | 99.5 /100 | #83 | Exceptional $54,369 |
| Bulgarians | 99.5 /100 | #84 | Exceptional $54,352 |
Demographics Similar to Alaskan Athabascans by Householder Income Under 25 years
In terms of householder income under 25 years, the demographic groups most similar to Alaskan Athabascans are Immigrants from South Africa ($51,705, a difference of 0.020%), Immigrants from Latvia ($51,737, a difference of 0.050%), Paiute ($51,743, a difference of 0.060%), Northern European ($51,678, a difference of 0.070%), and Croatian ($51,662, a difference of 0.10%).
| Demographics | Rating | Rank | Householder Income Under 25 years |
| Basques | 28.7 /100 | #179 | Fair $51,818 |
| Immigrants | England | 28.7 /100 | #180 | Fair $51,817 |
| Europeans | 27.6 /100 | #181 | Fair $51,796 |
| Jordanians | 27.6 /100 | #182 | Fair $51,796 |
| Mexican American Indians | 27.0 /100 | #183 | Fair $51,783 |
| Paiute | 25.1 /100 | #184 | Fair $51,743 |
| Immigrants | Latvia | 24.8 /100 | #185 | Fair $51,737 |
| Alaskan Athabascans | 23.8 /100 | #186 | Fair $51,713 |
| Immigrants | South Africa | 23.4 /100 | #187 | Fair $51,705 |
| Northern Europeans | 22.2 /100 | #188 | Fair $51,678 |
| Croatians | 21.6 /100 | #189 | Fair $51,662 |
| Malaysians | 19.7 /100 | #190 | Poor $51,615 |
| Panamanians | 19.5 /100 | #191 | Poor $51,611 |
| West Indians | 18.5 /100 | #192 | Poor $51,583 |
| Immigrants | Eritrea | 18.1 /100 | #193 | Poor $51,574 |