Asian vs Alaskan Athabascan Householder Income Under 25 years
COMPARE
Asian
Alaskan Athabascan
Householder Income Under 25 years
Householder Income Under 25 years Comparison
Asians
Alaskan Athabascans
$57,003
HOUSEHOLDER INCOME UNDER 25 YEARS
100.0/ 100
METRIC RATING
22nd/ 347
METRIC RANK
$51,713
HOUSEHOLDER INCOME UNDER 25 YEARS
23.8/ 100
METRIC RATING
186th/ 347
METRIC RANK
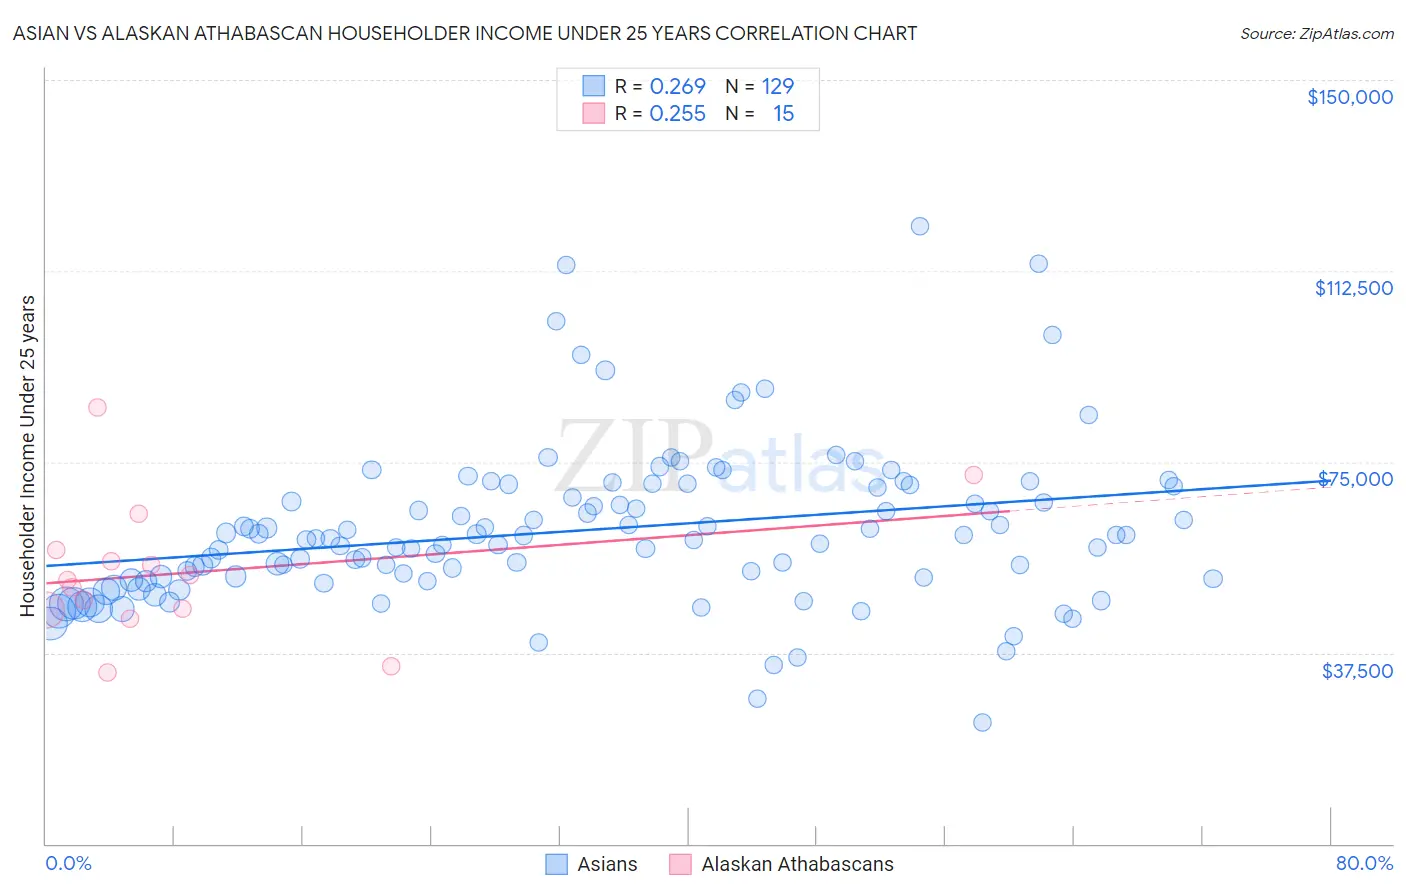
Asian vs Alaskan Athabascan Householder Income Under 25 years Correlation Chart
The statistical analysis conducted on geographies consisting of 432,159,205 people shows a weak positive correlation between the proportion of Asians and household income with householder under the age of 25 in the United States with a correlation coefficient (R) of 0.269 and weighted average of $57,003. Similarly, the statistical analysis conducted on geographies consisting of 43,356,340 people shows a weak positive correlation between the proportion of Alaskan Athabascans and household income with householder under the age of 25 in the United States with a correlation coefficient (R) of 0.255 and weighted average of $51,713, a difference of 10.2%.
Householder Income Under 25 years Correlation Summary
| Measurement | Asian | Alaskan Athabascan |
| Minimum | $23,919 | $33,750 |
| Maximum | $121,254 | $85,791 |
| Range | $97,335 | $52,041 |
| Mean | $61,525 | $53,228 |
| Median | $59,979 | $51,876 |
| Interquartile 25% (IQ1) | $51,878 | $45,858 |
| Interquartile 75% (IQ3) | $70,096 | $57,780 |
| Interquartile Range (IQR) | $18,219 | $11,922 |
| Standard Deviation (Sample) | $15,684 | $13,457 |
| Standard Deviation (Population) | $15,623 | $13,000 |
Similar Demographics by Householder Income Under 25 years
Demographics Similar to Asians by Householder Income Under 25 years
In terms of householder income under 25 years, the demographic groups most similar to Asians are Tongan ($56,972, a difference of 0.050%), Immigrants from Fiji ($57,074, a difference of 0.12%), Bhutanese ($57,078, a difference of 0.13%), Immigrants from Ireland ($57,075, a difference of 0.13%), and Immigrants from Eastern Asia ($57,123, a difference of 0.21%).
| Demographics | Rating | Rank | Householder Income Under 25 years |
| Koreans | 100.0 /100 | #15 | Exceptional $57,730 |
| Immigrants | Afghanistan | 100.0 /100 | #16 | Exceptional $57,478 |
| Sierra Leoneans | 100.0 /100 | #17 | Exceptional $57,272 |
| Immigrants | Eastern Asia | 100.0 /100 | #18 | Exceptional $57,123 |
| Bhutanese | 100.0 /100 | #19 | Exceptional $57,078 |
| Immigrants | Ireland | 100.0 /100 | #20 | Exceptional $57,075 |
| Immigrants | Fiji | 100.0 /100 | #21 | Exceptional $57,074 |
| Asians | 100.0 /100 | #22 | Exceptional $57,003 |
| Tongans | 100.0 /100 | #23 | Exceptional $56,972 |
| Immigrants | Singapore | 100.0 /100 | #24 | Exceptional $56,835 |
| Immigrants | Pakistan | 100.0 /100 | #25 | Exceptional $56,789 |
| Immigrants | Australia | 100.0 /100 | #26 | Exceptional $56,660 |
| Immigrants | North Macedonia | 100.0 /100 | #27 | Exceptional $56,503 |
| Immigrants | Peru | 100.0 /100 | #28 | Exceptional $56,384 |
| Immigrants | Asia | 100.0 /100 | #29 | Exceptional $56,379 |
Demographics Similar to Alaskan Athabascans by Householder Income Under 25 years
In terms of householder income under 25 years, the demographic groups most similar to Alaskan Athabascans are Immigrants from South Africa ($51,705, a difference of 0.020%), Immigrants from Latvia ($51,737, a difference of 0.050%), Paiute ($51,743, a difference of 0.060%), Northern European ($51,678, a difference of 0.070%), and Croatian ($51,662, a difference of 0.10%).
| Demographics | Rating | Rank | Householder Income Under 25 years |
| Basques | 28.7 /100 | #179 | Fair $51,818 |
| Immigrants | England | 28.7 /100 | #180 | Fair $51,817 |
| Europeans | 27.6 /100 | #181 | Fair $51,796 |
| Jordanians | 27.6 /100 | #182 | Fair $51,796 |
| Mexican American Indians | 27.0 /100 | #183 | Fair $51,783 |
| Paiute | 25.1 /100 | #184 | Fair $51,743 |
| Immigrants | Latvia | 24.8 /100 | #185 | Fair $51,737 |
| Alaskan Athabascans | 23.8 /100 | #186 | Fair $51,713 |
| Immigrants | South Africa | 23.4 /100 | #187 | Fair $51,705 |
| Northern Europeans | 22.2 /100 | #188 | Fair $51,678 |
| Croatians | 21.6 /100 | #189 | Fair $51,662 |
| Malaysians | 19.7 /100 | #190 | Poor $51,615 |
| Panamanians | 19.5 /100 | #191 | Poor $51,611 |
| West Indians | 18.5 /100 | #192 | Poor $51,583 |
| Immigrants | Eritrea | 18.1 /100 | #193 | Poor $51,574 |