Canadian vs Fijian Householder Income Under 25 years
COMPARE
Canadian
Fijian
Householder Income Under 25 years
Householder Income Under 25 years Comparison
Canadians
Fijians
$52,336
HOUSEHOLDER INCOME UNDER 25 YEARS
58.8/ 100
METRIC RATING
169th/ 347
METRIC RANK
$50,132
HOUSEHOLDER INCOME UNDER 25 YEARS
0.6/ 100
METRIC RATING
264th/ 347
METRIC RANK
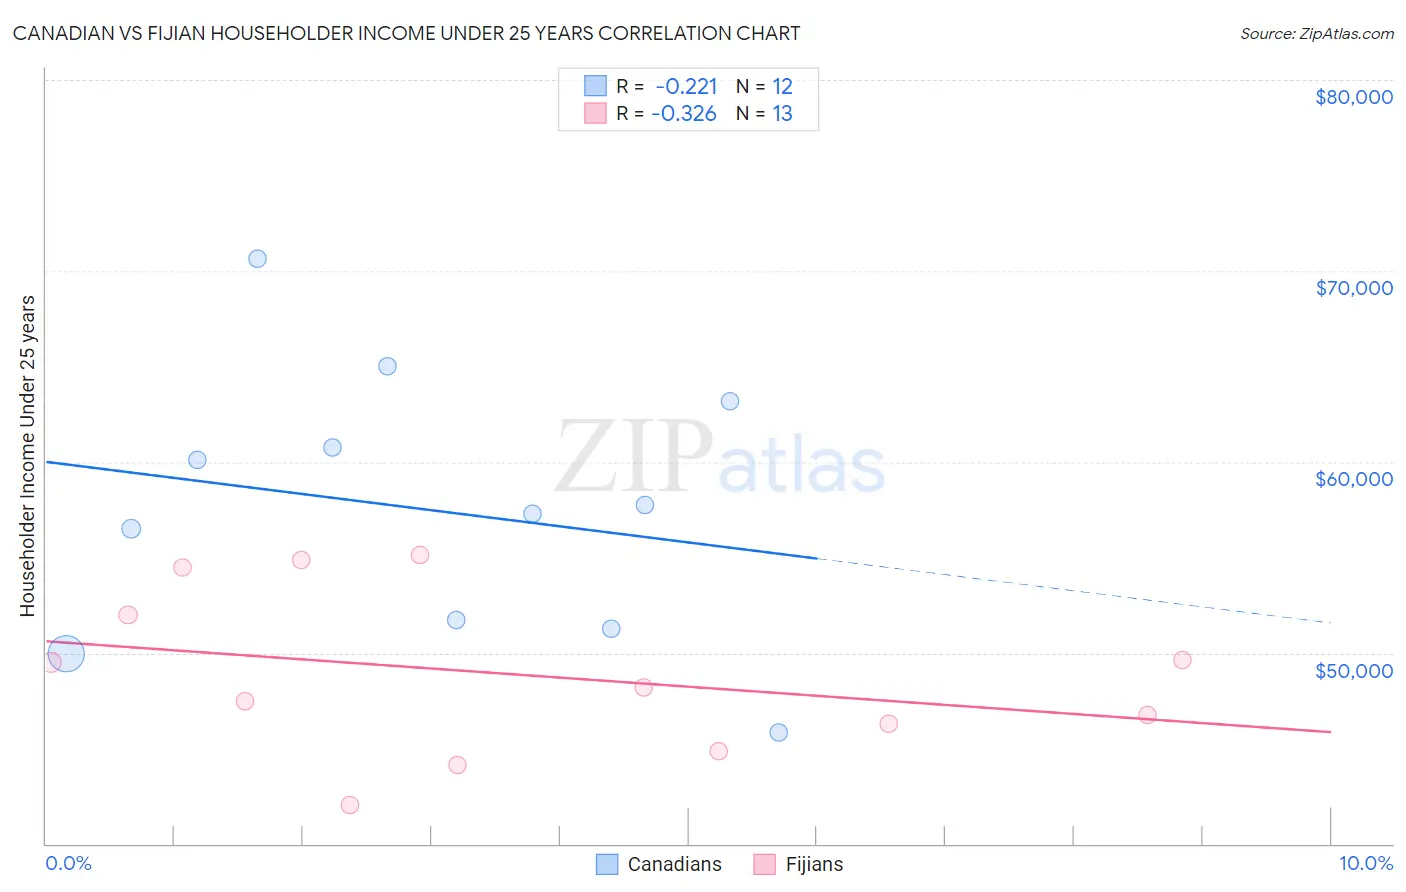
Canadian vs Fijian Householder Income Under 25 years Correlation Chart
The statistical analysis conducted on geographies consisting of 362,146,468 people shows a weak negative correlation between the proportion of Canadians and household income with householder under the age of 25 in the United States with a correlation coefficient (R) of -0.221 and weighted average of $52,336. Similarly, the statistical analysis conducted on geographies consisting of 53,807,935 people shows a mild negative correlation between the proportion of Fijians and household income with householder under the age of 25 in the United States with a correlation coefficient (R) of -0.326 and weighted average of $50,132, a difference of 4.4%.
Householder Income Under 25 years Correlation Summary
| Measurement | Canadian | Fijian |
| Minimum | $45,833 | $42,002 |
| Maximum | $70,623 | $55,154 |
| Range | $24,790 | $13,151 |
| Mean | $57,498 | $48,862 |
| Median | $57,522 | $48,154 |
| Interquartile 25% (IQ1) | $51,515 | $45,561 |
| Interquartile 75% (IQ3) | $61,958 | $53,230 |
| Interquartile Range (IQR) | $10,443 | $7,669 |
| Standard Deviation (Sample) | $7,030 | $4,254 |
| Standard Deviation (Population) | $6,730 | $4,087 |
Similar Demographics by Householder Income Under 25 years
Demographics Similar to Canadians by Householder Income Under 25 years
In terms of householder income under 25 years, the demographic groups most similar to Canadians are Israeli ($52,335, a difference of 0.0%), Japanese ($52,365, a difference of 0.060%), Immigrants from Uganda ($52,374, a difference of 0.070%), Immigrants from Uruguay ($52,302, a difference of 0.070%), and Immigrants from Austria ($52,400, a difference of 0.12%).
| Demographics | Rating | Rank | Householder Income Under 25 years |
| Immigrants | Cambodia | 65.4 /100 | #162 | Good $52,450 |
| Immigrants | Chile | 64.8 /100 | #163 | Good $52,440 |
| Immigrants | Trinidad and Tobago | 64.7 /100 | #164 | Good $52,437 |
| Poles | 63.0 /100 | #165 | Good $52,407 |
| Immigrants | Austria | 62.6 /100 | #166 | Good $52,400 |
| Immigrants | Uganda | 61.1 /100 | #167 | Good $52,374 |
| Japanese | 60.5 /100 | #168 | Good $52,365 |
| Canadians | 58.8 /100 | #169 | Average $52,336 |
| Israelis | 58.8 /100 | #170 | Average $52,335 |
| Immigrants | Uruguay | 56.8 /100 | #171 | Average $52,302 |
| Cypriots | 51.2 /100 | #172 | Average $52,209 |
| Barbadians | 50.8 /100 | #173 | Average $52,202 |
| Immigrants | Western Asia | 50.0 /100 | #174 | Average $52,190 |
| Immigrants | Zimbabwe | 33.8 /100 | #175 | Fair $51,914 |
| Austrians | 32.9 /100 | #176 | Fair $51,898 |
Demographics Similar to Fijians by Householder Income Under 25 years
In terms of householder income under 25 years, the demographic groups most similar to Fijians are Belgian ($50,113, a difference of 0.040%), Immigrants from Venezuela ($50,109, a difference of 0.050%), Immigrants from Dominican Republic ($50,204, a difference of 0.14%), Immigrants from Laos ($50,041, a difference of 0.18%), and Haitian ($50,231, a difference of 0.20%).
| Demographics | Rating | Rank | Householder Income Under 25 years |
| Lebanese | 1.1 /100 | #257 | Tragic $50,355 |
| Whites/Caucasians | 1.1 /100 | #258 | Tragic $50,336 |
| Immigrants | Dominica | 1.0 /100 | #259 | Tragic $50,301 |
| Hispanics or Latinos | 0.9 /100 | #260 | Tragic $50,279 |
| Hungarians | 0.9 /100 | #261 | Tragic $50,247 |
| Haitians | 0.8 /100 | #262 | Tragic $50,231 |
| Immigrants | Dominican Republic | 0.8 /100 | #263 | Tragic $50,204 |
| Fijians | 0.6 /100 | #264 | Tragic $50,132 |
| Belgians | 0.6 /100 | #265 | Tragic $50,113 |
| Immigrants | Venezuela | 0.6 /100 | #266 | Tragic $50,109 |
| Immigrants | Laos | 0.5 /100 | #267 | Tragic $50,041 |
| Venezuelans | 0.5 /100 | #268 | Tragic $50,011 |
| Ute | 0.5 /100 | #269 | Tragic $49,997 |
| Mexicans | 0.5 /100 | #270 | Tragic $49,989 |
| Taiwanese | 0.3 /100 | #271 | Tragic $49,804 |