Canadian vs Russian Householder Income Under 25 years
COMPARE
Canadian
Russian
Householder Income Under 25 years
Householder Income Under 25 years Comparison
Canadians
Russians
$52,336
HOUSEHOLDER INCOME UNDER 25 YEARS
58.8/ 100
METRIC RATING
169th/ 347
METRIC RANK
$54,389
HOUSEHOLDER INCOME UNDER 25 YEARS
99.5/ 100
METRIC RATING
82nd/ 347
METRIC RANK
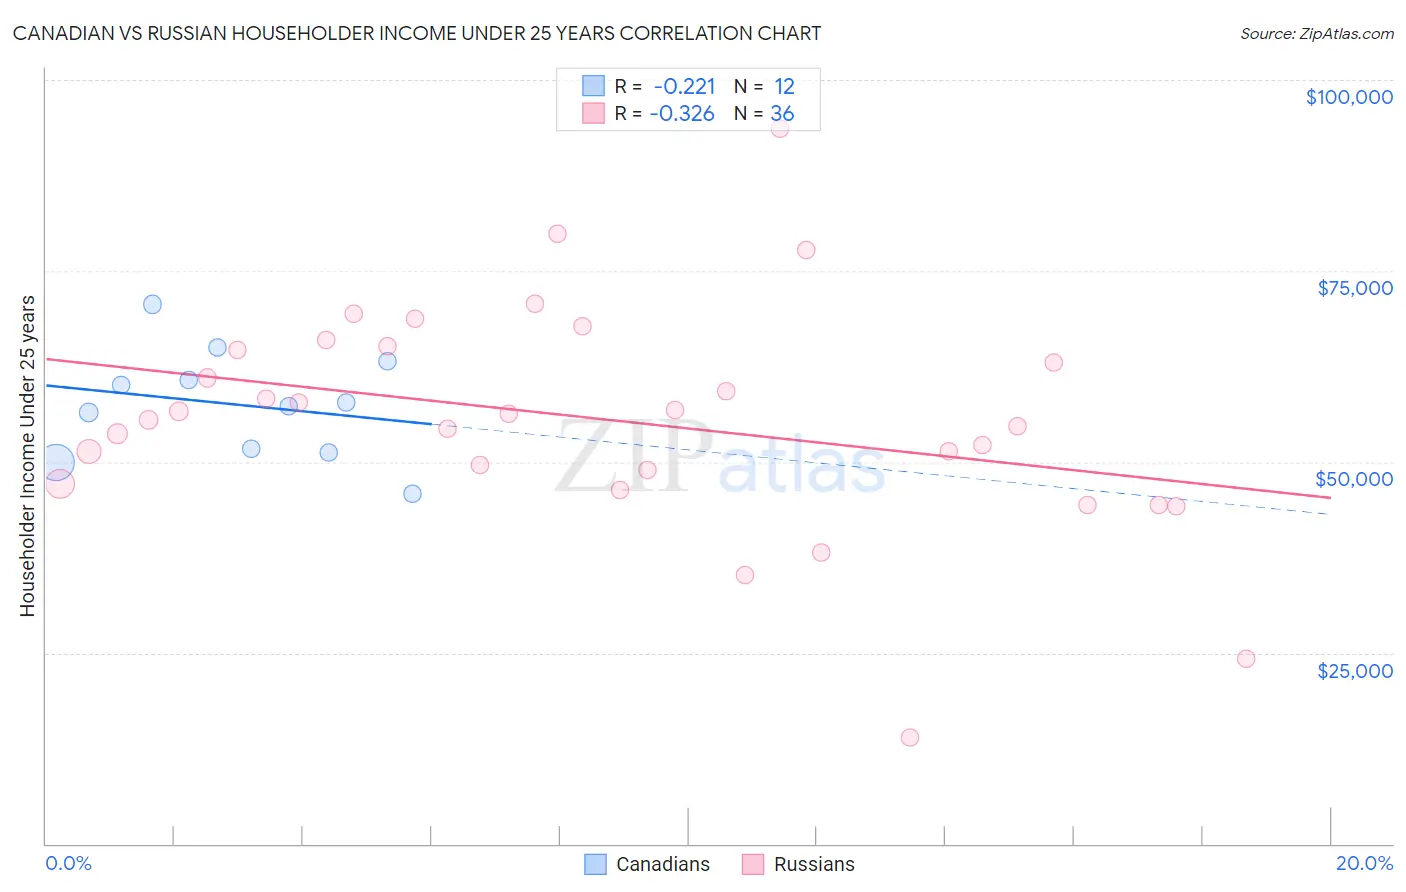
Canadian vs Russian Householder Income Under 25 years Correlation Chart
The statistical analysis conducted on geographies consisting of 362,146,468 people shows a weak negative correlation between the proportion of Canadians and household income with householder under the age of 25 in the United States with a correlation coefficient (R) of -0.221 and weighted average of $52,336. Similarly, the statistical analysis conducted on geographies consisting of 408,933,580 people shows a mild negative correlation between the proportion of Russians and household income with householder under the age of 25 in the United States with a correlation coefficient (R) of -0.326 and weighted average of $54,389, a difference of 3.9%.
Householder Income Under 25 years Correlation Summary
| Measurement | Canadian | Russian |
| Minimum | $45,833 | $13,906 |
| Maximum | $70,623 | $93,571 |
| Range | $24,790 | $79,665 |
| Mean | $57,498 | $55,615 |
| Median | $57,522 | $55,875 |
| Interquartile 25% (IQ1) | $51,515 | $48,025 |
| Interquartile 75% (IQ3) | $61,958 | $64,893 |
| Interquartile Range (IQR) | $10,443 | $16,868 |
| Standard Deviation (Sample) | $7,030 | $14,911 |
| Standard Deviation (Population) | $6,730 | $14,703 |
Similar Demographics by Householder Income Under 25 years
Demographics Similar to Canadians by Householder Income Under 25 years
In terms of householder income under 25 years, the demographic groups most similar to Canadians are Israeli ($52,335, a difference of 0.0%), Japanese ($52,365, a difference of 0.060%), Immigrants from Uganda ($52,374, a difference of 0.070%), Immigrants from Uruguay ($52,302, a difference of 0.070%), and Immigrants from Austria ($52,400, a difference of 0.12%).
| Demographics | Rating | Rank | Householder Income Under 25 years |
| Immigrants | Cambodia | 65.4 /100 | #162 | Good $52,450 |
| Immigrants | Chile | 64.8 /100 | #163 | Good $52,440 |
| Immigrants | Trinidad and Tobago | 64.7 /100 | #164 | Good $52,437 |
| Poles | 63.0 /100 | #165 | Good $52,407 |
| Immigrants | Austria | 62.6 /100 | #166 | Good $52,400 |
| Immigrants | Uganda | 61.1 /100 | #167 | Good $52,374 |
| Japanese | 60.5 /100 | #168 | Good $52,365 |
| Canadians | 58.8 /100 | #169 | Average $52,336 |
| Israelis | 58.8 /100 | #170 | Average $52,335 |
| Immigrants | Uruguay | 56.8 /100 | #171 | Average $52,302 |
| Cypriots | 51.2 /100 | #172 | Average $52,209 |
| Barbadians | 50.8 /100 | #173 | Average $52,202 |
| Immigrants | Western Asia | 50.0 /100 | #174 | Average $52,190 |
| Immigrants | Zimbabwe | 33.8 /100 | #175 | Fair $51,914 |
| Austrians | 32.9 /100 | #176 | Fair $51,898 |
Demographics Similar to Russians by Householder Income Under 25 years
In terms of householder income under 25 years, the demographic groups most similar to Russians are Laotian ($54,369, a difference of 0.040%), Bulgarian ($54,352, a difference of 0.070%), Immigrants from Czechoslovakia ($54,352, a difference of 0.070%), Portuguese ($54,436, a difference of 0.090%), and Immigrants from Croatia ($54,343, a difference of 0.090%).
| Demographics | Rating | Rank | Householder Income Under 25 years |
| Immigrants | Sri Lanka | 99.7 /100 | #75 | Exceptional $54,512 |
| Immigrants | Brazil | 99.6 /100 | #76 | Exceptional $54,487 |
| Immigrants | Southern Europe | 99.6 /100 | #77 | Exceptional $54,484 |
| Nepalese | 99.6 /100 | #78 | Exceptional $54,472 |
| Immigrants | Italy | 99.6 /100 | #79 | Exceptional $54,449 |
| Egyptians | 99.6 /100 | #80 | Exceptional $54,444 |
| Portuguese | 99.6 /100 | #81 | Exceptional $54,436 |
| Russians | 99.5 /100 | #82 | Exceptional $54,389 |
| Laotians | 99.5 /100 | #83 | Exceptional $54,369 |
| Bulgarians | 99.5 /100 | #84 | Exceptional $54,352 |
| Immigrants | Czechoslovakia | 99.5 /100 | #85 | Exceptional $54,352 |
| Immigrants | Croatia | 99.5 /100 | #86 | Exceptional $54,343 |
| Brazilians | 99.5 /100 | #87 | Exceptional $54,335 |
| Yakama | 99.5 /100 | #88 | Exceptional $54,321 |
| Immigrants | South America | 99.4 /100 | #89 | Exceptional $54,268 |