Canadian vs West Indian Householder Income Under 25 years
COMPARE
Canadian
West Indian
Householder Income Under 25 years
Householder Income Under 25 years Comparison
Canadians
West Indians
$52,336
HOUSEHOLDER INCOME UNDER 25 YEARS
58.8/ 100
METRIC RATING
169th/ 347
METRIC RANK
$51,583
HOUSEHOLDER INCOME UNDER 25 YEARS
18.5/ 100
METRIC RATING
192nd/ 347
METRIC RANK
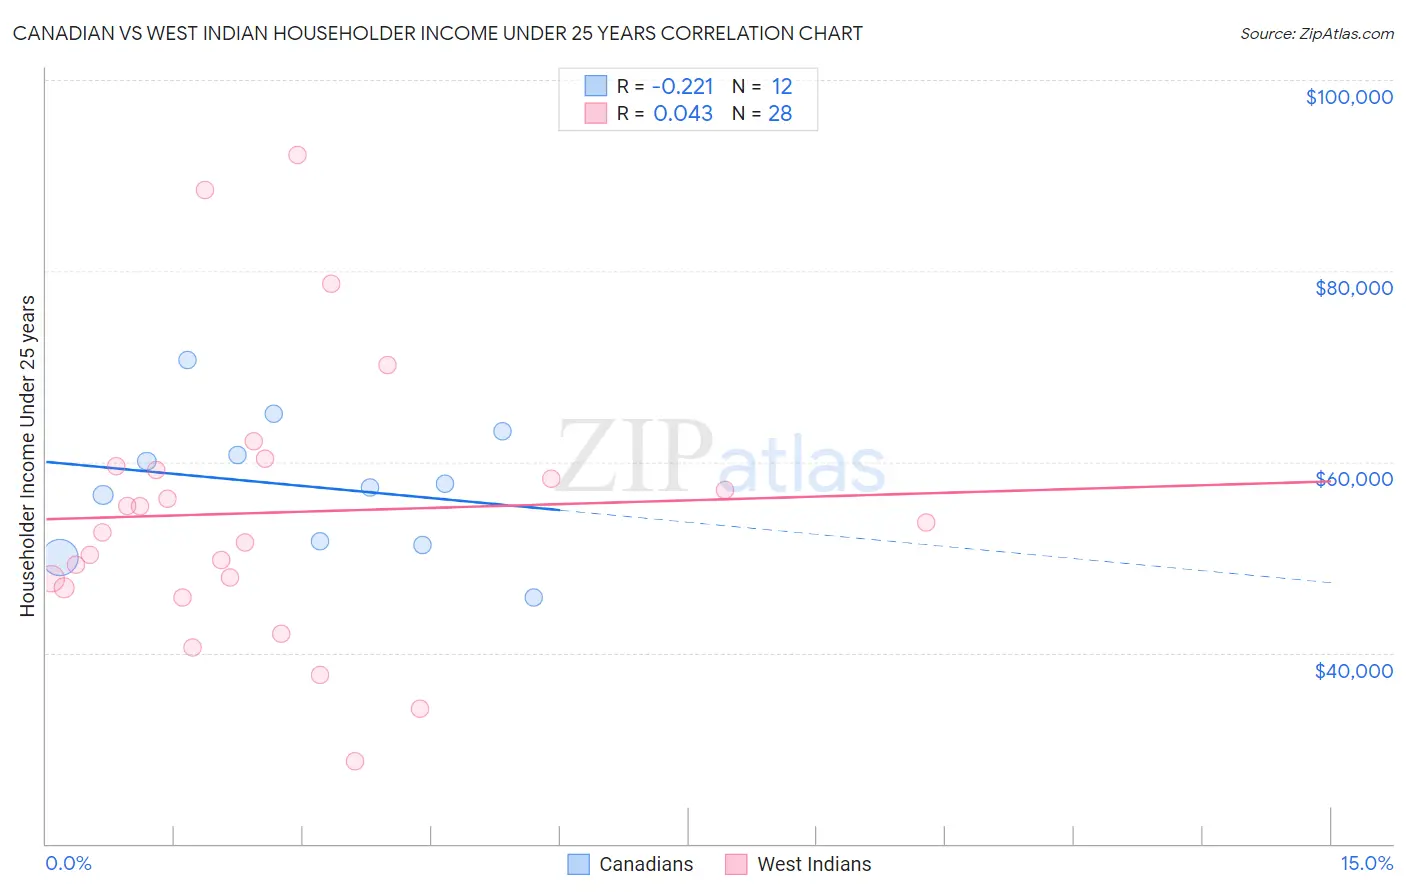
Canadian vs West Indian Householder Income Under 25 years Correlation Chart
The statistical analysis conducted on geographies consisting of 362,146,468 people shows a weak negative correlation between the proportion of Canadians and household income with householder under the age of 25 in the United States with a correlation coefficient (R) of -0.221 and weighted average of $52,336. Similarly, the statistical analysis conducted on geographies consisting of 221,989,526 people shows no correlation between the proportion of West Indians and household income with householder under the age of 25 in the United States with a correlation coefficient (R) of 0.043 and weighted average of $51,583, a difference of 1.5%.
Householder Income Under 25 years Correlation Summary
| Measurement | Canadian | West Indian |
| Minimum | $45,833 | $28,623 |
| Maximum | $70,623 | $92,155 |
| Range | $24,790 | $63,532 |
| Mean | $57,498 | $54,678 |
| Median | $57,522 | $53,085 |
| Interquartile 25% (IQ1) | $51,515 | $47,297 |
| Interquartile 75% (IQ3) | $61,958 | $59,304 |
| Interquartile Range (IQR) | $10,443 | $12,007 |
| Standard Deviation (Sample) | $7,030 | $14,375 |
| Standard Deviation (Population) | $6,730 | $14,116 |
Similar Demographics by Householder Income Under 25 years
Demographics Similar to Canadians by Householder Income Under 25 years
In terms of householder income under 25 years, the demographic groups most similar to Canadians are Israeli ($52,335, a difference of 0.0%), Japanese ($52,365, a difference of 0.060%), Immigrants from Uganda ($52,374, a difference of 0.070%), Immigrants from Uruguay ($52,302, a difference of 0.070%), and Immigrants from Austria ($52,400, a difference of 0.12%).
| Demographics | Rating | Rank | Householder Income Under 25 years |
| Immigrants | Cambodia | 65.4 /100 | #162 | Good $52,450 |
| Immigrants | Chile | 64.8 /100 | #163 | Good $52,440 |
| Immigrants | Trinidad and Tobago | 64.7 /100 | #164 | Good $52,437 |
| Poles | 63.0 /100 | #165 | Good $52,407 |
| Immigrants | Austria | 62.6 /100 | #166 | Good $52,400 |
| Immigrants | Uganda | 61.1 /100 | #167 | Good $52,374 |
| Japanese | 60.5 /100 | #168 | Good $52,365 |
| Canadians | 58.8 /100 | #169 | Average $52,336 |
| Israelis | 58.8 /100 | #170 | Average $52,335 |
| Immigrants | Uruguay | 56.8 /100 | #171 | Average $52,302 |
| Cypriots | 51.2 /100 | #172 | Average $52,209 |
| Barbadians | 50.8 /100 | #173 | Average $52,202 |
| Immigrants | Western Asia | 50.0 /100 | #174 | Average $52,190 |
| Immigrants | Zimbabwe | 33.8 /100 | #175 | Fair $51,914 |
| Austrians | 32.9 /100 | #176 | Fair $51,898 |
Demographics Similar to West Indians by Householder Income Under 25 years
In terms of householder income under 25 years, the demographic groups most similar to West Indians are Immigrants from Eritrea ($51,574, a difference of 0.020%), Malaysian ($51,615, a difference of 0.060%), Panamanian ($51,611, a difference of 0.060%), Guatemalan ($51,525, a difference of 0.11%), and Estonian ($51,523, a difference of 0.12%).
| Demographics | Rating | Rank | Householder Income Under 25 years |
| Immigrants | Latvia | 24.8 /100 | #185 | Fair $51,737 |
| Alaskan Athabascans | 23.8 /100 | #186 | Fair $51,713 |
| Immigrants | South Africa | 23.4 /100 | #187 | Fair $51,705 |
| Northern Europeans | 22.2 /100 | #188 | Fair $51,678 |
| Croatians | 21.6 /100 | #189 | Fair $51,662 |
| Malaysians | 19.7 /100 | #190 | Poor $51,615 |
| Panamanians | 19.5 /100 | #191 | Poor $51,611 |
| West Indians | 18.5 /100 | #192 | Poor $51,583 |
| Immigrants | Eritrea | 18.1 /100 | #193 | Poor $51,574 |
| Guatemalans | 16.4 /100 | #194 | Poor $51,525 |
| Estonians | 16.4 /100 | #195 | Poor $51,523 |
| Palestinians | 16.1 /100 | #196 | Poor $51,515 |
| Pima | 15.7 /100 | #197 | Poor $51,503 |
| Immigrants | Syria | 15.4 /100 | #198 | Poor $51,494 |
| Swiss | 15.4 /100 | #199 | Poor $51,493 |