Immigrants from Dominican Republic vs Paraguayan Median Family Income
COMPARE
Immigrants from Dominican Republic
Paraguayan
Median Family Income
Median Family Income Comparison
Immigrants from Dominican Republic
Paraguayans
$81,233
MEDIAN FAMILY INCOME
0.0/ 100
METRIC RATING
331st/ 347
METRIC RANK
$114,016
MEDIAN FAMILY INCOME
99.7/ 100
METRIC RATING
66th/ 347
METRIC RANK
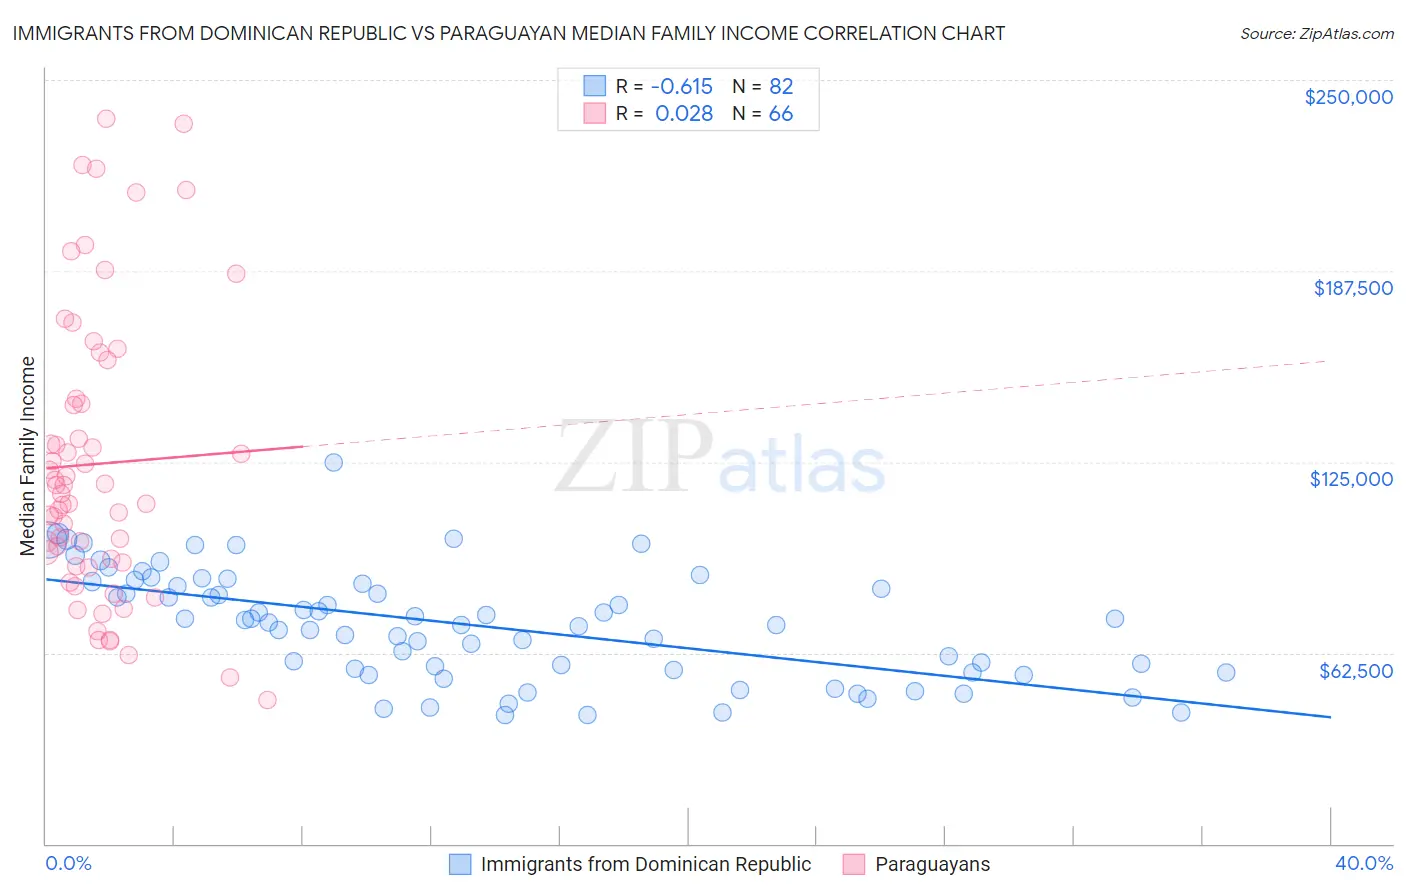
Immigrants from Dominican Republic vs Paraguayan Median Family Income Correlation Chart
The statistical analysis conducted on geographies consisting of 274,877,743 people shows a significant negative correlation between the proportion of Immigrants from Dominican Republic and median family income in the United States with a correlation coefficient (R) of -0.615 and weighted average of $81,233. Similarly, the statistical analysis conducted on geographies consisting of 95,094,698 people shows no correlation between the proportion of Paraguayans and median family income in the United States with a correlation coefficient (R) of 0.028 and weighted average of $114,016, a difference of 40.4%.
Median Family Income Correlation Summary
| Measurement | Immigrants from Dominican Republic | Paraguayan |
| Minimum | $41,996 | $47,188 |
| Maximum | $124,734 | $237,188 |
| Range | $82,738 | $190,000 |
| Mean | $71,698 | $124,379 |
| Median | $72,932 | $115,994 |
| Interquartile 25% (IQ1) | $56,743 | $91,993 |
| Interquartile 75% (IQ3) | $84,954 | $145,560 |
| Interquartile Range (IQR) | $28,211 | $53,567 |
| Standard Deviation (Sample) | $17,899 | $46,622 |
| Standard Deviation (Population) | $17,789 | $46,268 |
Similar Demographics by Median Family Income
Demographics Similar to Immigrants from Dominican Republic by Median Family Income
In terms of median family income, the demographic groups most similar to Immigrants from Dominican Republic are Cheyenne ($81,385, a difference of 0.19%), Native/Alaskan ($80,908, a difference of 0.40%), Kiowa ($80,885, a difference of 0.43%), Dutch West Indian ($81,852, a difference of 0.76%), and Black/African American ($81,912, a difference of 0.84%).
| Demographics | Rating | Rank | Median Family Income |
| Creek | 0.0 /100 | #324 | Tragic $82,560 |
| Sioux | 0.0 /100 | #325 | Tragic $82,386 |
| Immigrants | Congo | 0.0 /100 | #326 | Tragic $82,216 |
| Arapaho | 0.0 /100 | #327 | Tragic $82,064 |
| Blacks/African Americans | 0.0 /100 | #328 | Tragic $81,912 |
| Dutch West Indians | 0.0 /100 | #329 | Tragic $81,852 |
| Cheyenne | 0.0 /100 | #330 | Tragic $81,385 |
| Immigrants | Dominican Republic | 0.0 /100 | #331 | Tragic $81,233 |
| Natives/Alaskans | 0.0 /100 | #332 | Tragic $80,908 |
| Kiowa | 0.0 /100 | #333 | Tragic $80,885 |
| Menominee | 0.0 /100 | #334 | Tragic $79,563 |
| Yup'ik | 0.0 /100 | #335 | Tragic $79,290 |
| Immigrants | Cuba | 0.0 /100 | #336 | Tragic $78,249 |
| Yuman | 0.0 /100 | #337 | Tragic $78,055 |
| Immigrants | Yemen | 0.0 /100 | #338 | Tragic $77,457 |
Demographics Similar to Paraguayans by Median Family Income
In terms of median family income, the demographic groups most similar to Paraguayans are Egyptian ($114,119, a difference of 0.090%), Immigrants from Spain ($113,815, a difference of 0.18%), Immigrants from Scotland ($114,392, a difference of 0.33%), Immigrants from Pakistan ($114,406, a difference of 0.34%), and Mongolian ($114,553, a difference of 0.47%).
| Demographics | Rating | Rank | Median Family Income |
| Immigrants | Netherlands | 99.8 /100 | #59 | Exceptional $114,987 |
| Immigrants | Latvia | 99.8 /100 | #60 | Exceptional $114,826 |
| Immigrants | Belarus | 99.8 /100 | #61 | Exceptional $114,586 |
| Mongolians | 99.8 /100 | #62 | Exceptional $114,553 |
| Immigrants | Pakistan | 99.8 /100 | #63 | Exceptional $114,406 |
| Immigrants | Scotland | 99.7 /100 | #64 | Exceptional $114,392 |
| Egyptians | 99.7 /100 | #65 | Exceptional $114,119 |
| Paraguayans | 99.7 /100 | #66 | Exceptional $114,016 |
| Immigrants | Spain | 99.7 /100 | #67 | Exceptional $113,815 |
| Immigrants | Serbia | 99.6 /100 | #68 | Exceptional $113,463 |
| Immigrants | Bulgaria | 99.6 /100 | #69 | Exceptional $113,461 |
| Immigrants | Romania | 99.6 /100 | #70 | Exceptional $113,434 |
| South Africans | 99.5 /100 | #71 | Exceptional $113,229 |
| Afghans | 99.5 /100 | #72 | Exceptional $112,971 |
| Laotians | 99.5 /100 | #73 | Exceptional $112,859 |