Immigrants from Nepal vs Immigrants from Burma/Myanmar Median Female Earnings
COMPARE
Immigrants from Nepal
Immigrants from Burma/Myanmar
Median Female Earnings
Median Female Earnings Comparison
Immigrants from Nepal
Immigrants from Burma/Myanmar
$40,704
MEDIAN FEMALE EARNINGS
89.0/ 100
METRIC RATING
135th/ 347
METRIC RANK
$38,028
MEDIAN FEMALE EARNINGS
3.0/ 100
METRIC RATING
242nd/ 347
METRIC RANK
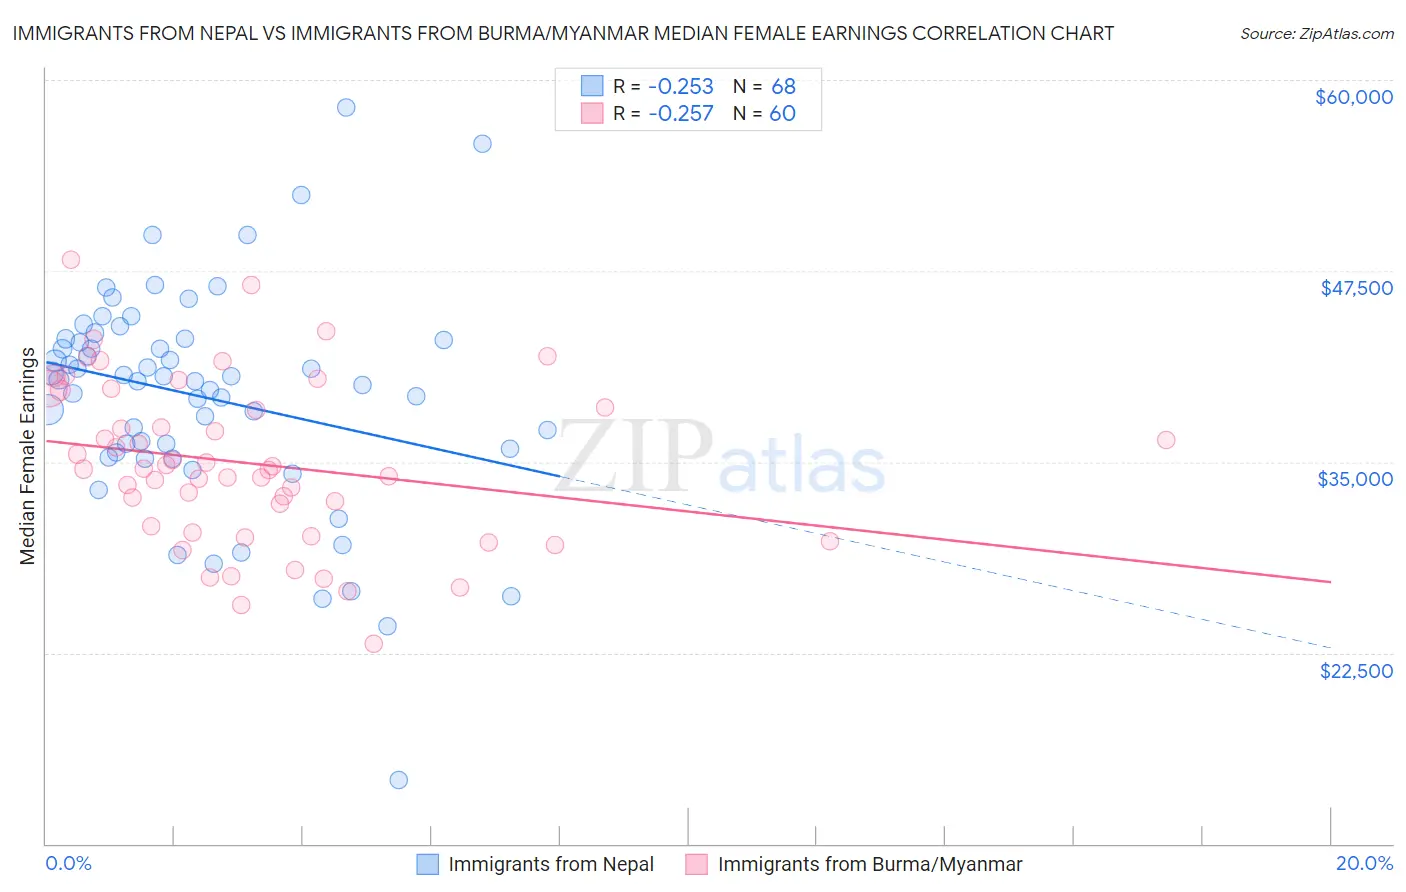
Immigrants from Nepal vs Immigrants from Burma/Myanmar Median Female Earnings Correlation Chart
The statistical analysis conducted on geographies consisting of 186,777,709 people shows a weak negative correlation between the proportion of Immigrants from Nepal and median female earnings in the United States with a correlation coefficient (R) of -0.253 and weighted average of $40,704. Similarly, the statistical analysis conducted on geographies consisting of 172,347,432 people shows a weak negative correlation between the proportion of Immigrants from Burma/Myanmar and median female earnings in the United States with a correlation coefficient (R) of -0.257 and weighted average of $38,028, a difference of 7.0%.
Median Female Earnings Correlation Summary
| Measurement | Immigrants from Nepal | Immigrants from Burma/Myanmar |
| Minimum | $14,200 | $23,125 |
| Maximum | $58,230 | $48,239 |
| Range | $44,030 | $25,114 |
| Mean | $39,241 | $34,892 |
| Median | $40,353 | $34,545 |
| Interquartile 25% (IQ1) | $35,758 | $30,606 |
| Interquartile 75% (IQ3) | $43,011 | $39,132 |
| Interquartile Range (IQR) | $7,253 | $8,525 |
| Standard Deviation (Sample) | $7,300 | $5,366 |
| Standard Deviation (Population) | $7,246 | $5,321 |
Similar Demographics by Median Female Earnings
Demographics Similar to Immigrants from Nepal by Median Female Earnings
In terms of median female earnings, the demographic groups most similar to Immigrants from Nepal are Arab ($40,718, a difference of 0.030%), Syrian ($40,727, a difference of 0.060%), Immigrants from Uganda ($40,739, a difference of 0.090%), Chilean ($40,757, a difference of 0.13%), and Immigrants from Eastern Africa ($40,644, a difference of 0.15%).
| Demographics | Rating | Rank | Median Female Earnings |
| Carpatho Rusyns | 91.2 /100 | #128 | Exceptional $40,825 |
| Zimbabweans | 90.8 /100 | #129 | Exceptional $40,798 |
| Immigrants | Guyana | 90.3 /100 | #130 | Exceptional $40,773 |
| Chileans | 90.0 /100 | #131 | Exceptional $40,757 |
| Immigrants | Uganda | 89.7 /100 | #132 | Excellent $40,739 |
| Syrians | 89.5 /100 | #133 | Excellent $40,727 |
| Arabs | 89.3 /100 | #134 | Excellent $40,718 |
| Immigrants | Nepal | 89.0 /100 | #135 | Excellent $40,704 |
| Immigrants | Eastern Africa | 87.7 /100 | #136 | Excellent $40,644 |
| Pakistanis | 86.6 /100 | #137 | Excellent $40,596 |
| Taiwanese | 86.1 /100 | #138 | Excellent $40,576 |
| Immigrants | South Eastern Asia | 85.7 /100 | #139 | Excellent $40,558 |
| Serbians | 85.2 /100 | #140 | Excellent $40,539 |
| Immigrants | Syria | 84.1 /100 | #141 | Excellent $40,499 |
| Sri Lankans | 84.0 /100 | #142 | Excellent $40,496 |
Demographics Similar to Immigrants from Burma/Myanmar by Median Female Earnings
In terms of median female earnings, the demographic groups most similar to Immigrants from Burma/Myanmar are German ($37,986, a difference of 0.11%), Immigrants from Liberia ($37,970, a difference of 0.15%), Immigrants from Middle Africa ($37,965, a difference of 0.17%), Delaware ($37,964, a difference of 0.17%), and Spanish ($38,098, a difference of 0.18%).
| Demographics | Rating | Rank | Median Female Earnings |
| Sudanese | 4.4 /100 | #235 | Tragic $38,215 |
| Liberians | 4.4 /100 | #236 | Tragic $38,215 |
| Immigrants | Cabo Verde | 4.3 /100 | #237 | Tragic $38,208 |
| Alaska Natives | 4.3 /100 | #238 | Tragic $38,202 |
| English | 4.2 /100 | #239 | Tragic $38,196 |
| Finns | 4.0 /100 | #240 | Tragic $38,173 |
| Spanish | 3.5 /100 | #241 | Tragic $38,098 |
| Immigrants | Burma/Myanmar | 3.0 /100 | #242 | Tragic $38,028 |
| Germans | 2.8 /100 | #243 | Tragic $37,986 |
| Immigrants | Liberia | 2.7 /100 | #244 | Tragic $37,970 |
| Immigrants | Middle Africa | 2.7 /100 | #245 | Tragic $37,965 |
| Delaware | 2.6 /100 | #246 | Tragic $37,964 |
| Immigrants | Somalia | 2.4 /100 | #247 | Tragic $37,914 |
| Alaskan Athabascans | 2.3 /100 | #248 | Tragic $37,905 |
| Swiss | 2.3 /100 | #249 | Tragic $37,904 |