Immigrants from Sudan vs Immigrants from Burma/Myanmar Median Female Earnings
COMPARE
Immigrants from Sudan
Immigrants from Burma/Myanmar
Median Female Earnings
Median Female Earnings Comparison
Immigrants from Sudan
Immigrants from Burma/Myanmar
$38,511
MEDIAN FEMALE EARNINGS
7.8/ 100
METRIC RATING
223rd/ 347
METRIC RANK
$38,028
MEDIAN FEMALE EARNINGS
3.0/ 100
METRIC RATING
242nd/ 347
METRIC RANK
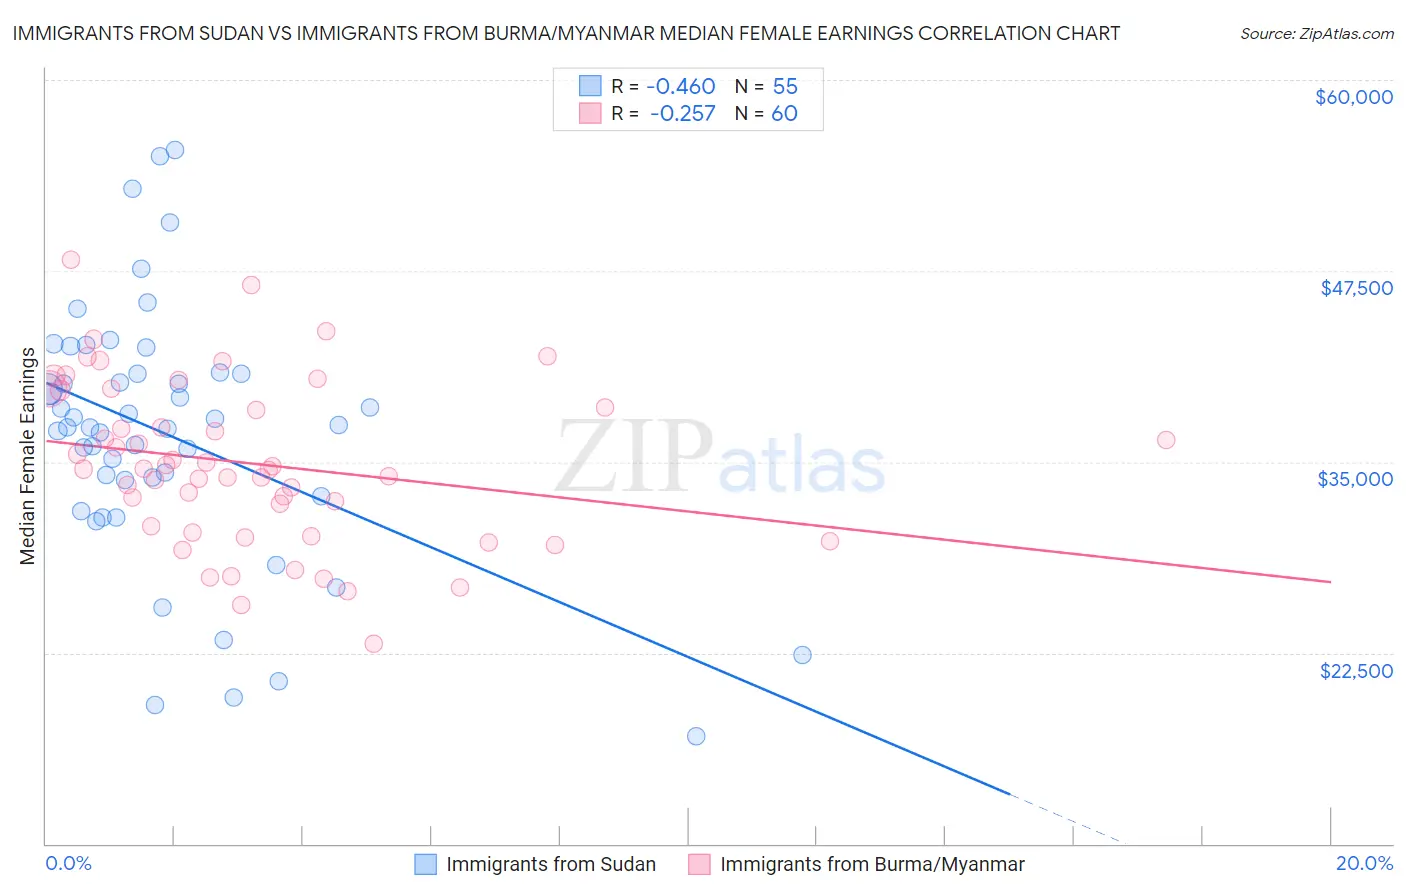
Immigrants from Sudan vs Immigrants from Burma/Myanmar Median Female Earnings Correlation Chart
The statistical analysis conducted on geographies consisting of 118,958,094 people shows a moderate negative correlation between the proportion of Immigrants from Sudan and median female earnings in the United States with a correlation coefficient (R) of -0.460 and weighted average of $38,511. Similarly, the statistical analysis conducted on geographies consisting of 172,347,432 people shows a weak negative correlation between the proportion of Immigrants from Burma/Myanmar and median female earnings in the United States with a correlation coefficient (R) of -0.257 and weighted average of $38,028, a difference of 1.3%.
Median Female Earnings Correlation Summary
| Measurement | Immigrants from Sudan | Immigrants from Burma/Myanmar |
| Minimum | $17,051 | $23,125 |
| Maximum | $55,449 | $48,239 |
| Range | $38,398 | $25,114 |
| Mean | $36,677 | $34,892 |
| Median | $37,284 | $34,545 |
| Interquartile 25% (IQ1) | $32,734 | $30,606 |
| Interquartile 75% (IQ3) | $40,805 | $39,132 |
| Interquartile Range (IQR) | $8,071 | $8,525 |
| Standard Deviation (Sample) | $8,385 | $5,366 |
| Standard Deviation (Population) | $8,308 | $5,321 |
Demographics Similar to Immigrants from Sudan and Immigrants from Burma/Myanmar by Median Female Earnings
In terms of median female earnings, the demographic groups most similar to Immigrants from Sudan are Japanese ($38,528, a difference of 0.040%), Native Hawaiian ($38,461, a difference of 0.13%), French ($38,457, a difference of 0.14%), French Canadian ($38,436, a difference of 0.20%), and Scottish ($38,397, a difference of 0.30%). Similarly, the demographic groups most similar to Immigrants from Burma/Myanmar are Spanish ($38,098, a difference of 0.18%), Finnish ($38,173, a difference of 0.38%), English ($38,196, a difference of 0.44%), Alaska Native ($38,202, a difference of 0.46%), and Immigrants from Cabo Verde ($38,208, a difference of 0.47%).
| Demographics | Rating | Rank | Median Female Earnings |
| Japanese | 8.1 /100 | #222 | Tragic $38,528 |
| Immigrants | Sudan | 7.8 /100 | #223 | Tragic $38,511 |
| Native Hawaiians | 7.1 /100 | #224 | Tragic $38,461 |
| French | 7.0 /100 | #225 | Tragic $38,457 |
| French Canadians | 6.8 /100 | #226 | Tragic $38,436 |
| Scottish | 6.3 /100 | #227 | Tragic $38,397 |
| Sub-Saharan Africans | 6.2 /100 | #228 | Tragic $38,391 |
| Belgians | 6.1 /100 | #229 | Tragic $38,382 |
| Basques | 5.7 /100 | #230 | Tragic $38,352 |
| Somalis | 5.5 /100 | #231 | Tragic $38,333 |
| Scandinavians | 5.2 /100 | #232 | Tragic $38,306 |
| Tongans | 5.1 /100 | #233 | Tragic $38,288 |
| Celtics | 5.0 /100 | #234 | Tragic $38,283 |
| Sudanese | 4.4 /100 | #235 | Tragic $38,215 |
| Liberians | 4.4 /100 | #236 | Tragic $38,215 |
| Immigrants | Cabo Verde | 4.3 /100 | #237 | Tragic $38,208 |
| Alaska Natives | 4.3 /100 | #238 | Tragic $38,202 |
| English | 4.2 /100 | #239 | Tragic $38,196 |
| Finns | 4.0 /100 | #240 | Tragic $38,173 |
| Spanish | 3.5 /100 | #241 | Tragic $38,098 |
| Immigrants | Burma/Myanmar | 3.0 /100 | #242 | Tragic $38,028 |