Cajun vs Inupiat Median Family Income
COMPARE
Cajun
Inupiat
Median Family Income
Median Family Income Comparison
Cajuns
Inupiat
$87,157
MEDIAN FAMILY INCOME
0.0/ 100
METRIC RATING
297th/ 347
METRIC RANK
$91,730
MEDIAN FAMILY INCOME
0.4/ 100
METRIC RATING
261st/ 347
METRIC RANK
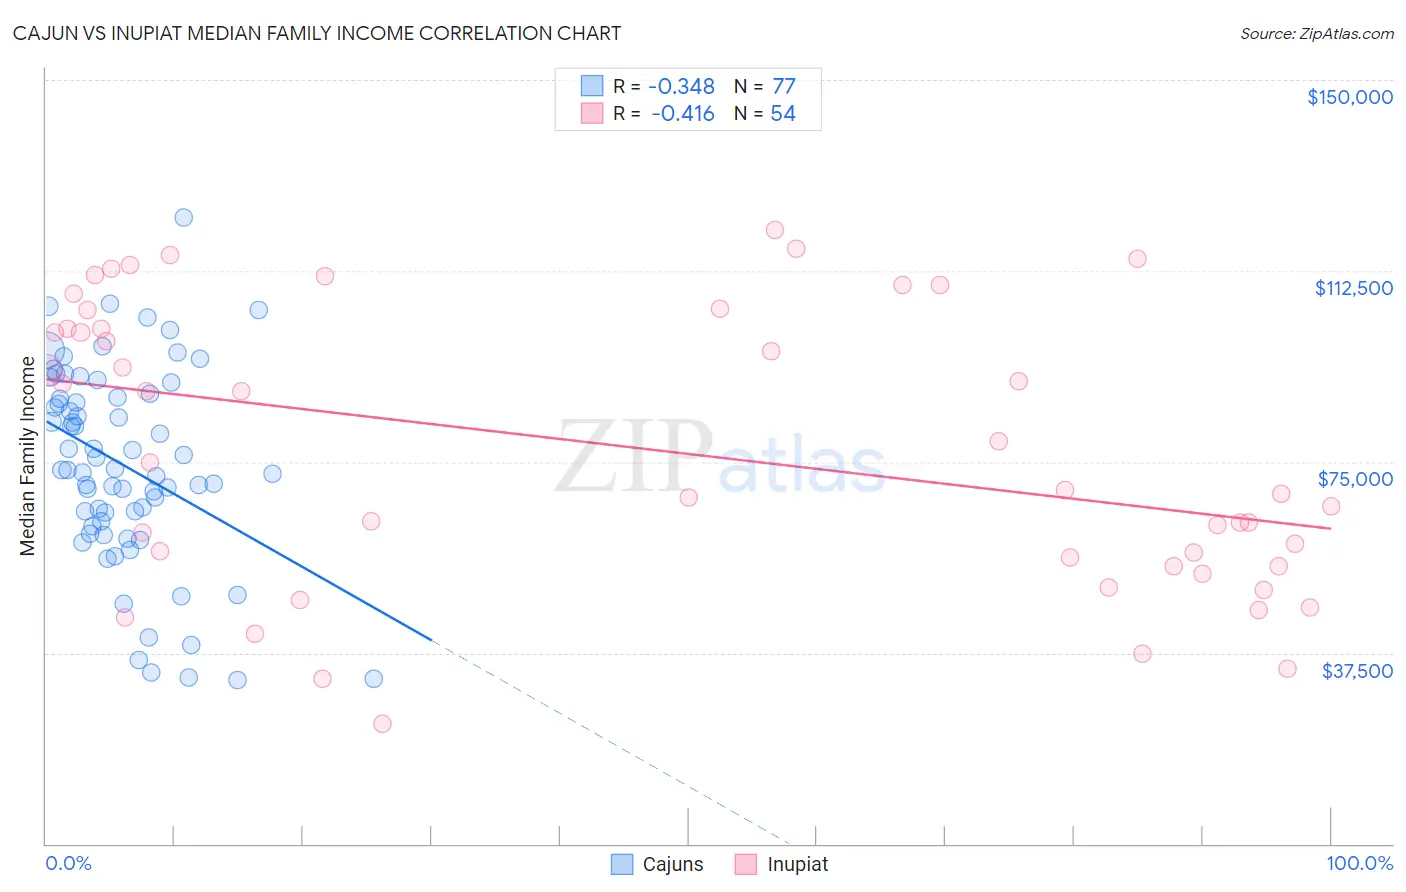
Cajun vs Inupiat Median Family Income Correlation Chart
The statistical analysis conducted on geographies consisting of 149,670,371 people shows a mild negative correlation between the proportion of Cajuns and median family income in the United States with a correlation coefficient (R) of -0.348 and weighted average of $87,157. Similarly, the statistical analysis conducted on geographies consisting of 96,309,592 people shows a moderate negative correlation between the proportion of Inupiat and median family income in the United States with a correlation coefficient (R) of -0.416 and weighted average of $91,730, a difference of 5.2%.
Median Family Income Correlation Summary
| Measurement | Cajun | Inupiat |
| Minimum | $32,222 | $23,690 |
| Maximum | $122,896 | $120,501 |
| Range | $90,674 | $96,811 |
| Mean | $74,286 | $77,500 |
| Median | $73,392 | $72,103 |
| Interquartile 25% (IQ1) | $62,875 | $54,583 |
| Interquartile 75% (IQ3) | $88,056 | $101,242 |
| Interquartile Range (IQR) | $25,181 | $46,659 |
| Standard Deviation (Sample) | $19,414 | $27,340 |
| Standard Deviation (Population) | $19,288 | $27,086 |
Similar Demographics by Median Family Income
Demographics Similar to Cajuns by Median Family Income
In terms of median family income, the demographic groups most similar to Cajuns are Immigrants from Guatemala ($87,191, a difference of 0.040%), Yaqui ($87,289, a difference of 0.15%), Immigrants from Latin America ($86,989, a difference of 0.19%), Fijian ($87,387, a difference of 0.26%), and Chippewa ($86,852, a difference of 0.35%).
| Demographics | Rating | Rank | Median Family Income |
| Shoshone | 0.1 /100 | #290 | Tragic $87,872 |
| Immigrants | Cabo Verde | 0.1 /100 | #291 | Tragic $87,830 |
| Africans | 0.1 /100 | #292 | Tragic $87,820 |
| Ute | 0.0 /100 | #293 | Tragic $87,596 |
| Fijians | 0.0 /100 | #294 | Tragic $87,387 |
| Yaqui | 0.0 /100 | #295 | Tragic $87,289 |
| Immigrants | Guatemala | 0.0 /100 | #296 | Tragic $87,191 |
| Cajuns | 0.0 /100 | #297 | Tragic $87,157 |
| Immigrants | Latin America | 0.0 /100 | #298 | Tragic $86,989 |
| Chippewa | 0.0 /100 | #299 | Tragic $86,852 |
| Ottawa | 0.0 /100 | #300 | Tragic $86,380 |
| Colville | 0.0 /100 | #301 | Tragic $85,792 |
| Spanish American Indians | 0.0 /100 | #302 | Tragic $85,728 |
| Hispanics or Latinos | 0.0 /100 | #303 | Tragic $85,647 |
| Mexicans | 0.0 /100 | #304 | Tragic $85,618 |
Demographics Similar to Inupiat by Median Family Income
In terms of median family income, the demographic groups most similar to Inupiat are Liberian ($91,722, a difference of 0.010%), Pennsylvania German ($91,763, a difference of 0.040%), Cape Verdean ($91,848, a difference of 0.13%), Immigrants from West Indies ($91,588, a difference of 0.16%), and Osage ($91,926, a difference of 0.21%).
| Demographics | Rating | Rank | Median Family Income |
| Immigrants | Barbados | 0.5 /100 | #254 | Tragic $92,419 |
| Immigrants | Laos | 0.5 /100 | #255 | Tragic $92,239 |
| Nicaraguans | 0.5 /100 | #256 | Tragic $92,231 |
| Americans | 0.4 /100 | #257 | Tragic $92,096 |
| Osage | 0.4 /100 | #258 | Tragic $91,926 |
| Cape Verdeans | 0.4 /100 | #259 | Tragic $91,848 |
| Pennsylvania Germans | 0.4 /100 | #260 | Tragic $91,763 |
| Inupiat | 0.4 /100 | #261 | Tragic $91,730 |
| Liberians | 0.4 /100 | #262 | Tragic $91,722 |
| Immigrants | West Indies | 0.3 /100 | #263 | Tragic $91,588 |
| Senegalese | 0.3 /100 | #264 | Tragic $91,475 |
| Hmong | 0.3 /100 | #265 | Tragic $91,296 |
| Central Americans | 0.3 /100 | #266 | Tragic $91,087 |
| Mexican American Indians | 0.2 /100 | #267 | Tragic $90,918 |
| Cree | 0.2 /100 | #268 | Tragic $90,882 |