Burmese vs Chippewa Householder Income Ages 45 - 64 years
COMPARE
Burmese
Chippewa
Householder Income Ages 45 - 64 years
Householder Income Ages 45 - 64 years Comparison
Burmese
Chippewa
$121,444
HOUSEHOLDER INCOME AGES 45 - 64 YEARS
100.0/ 100
METRIC RATING
17th/ 347
METRIC RANK
$83,943
HOUSEHOLDER INCOME AGES 45 - 64 YEARS
0.0/ 100
METRIC RATING
305th/ 347
METRIC RANK
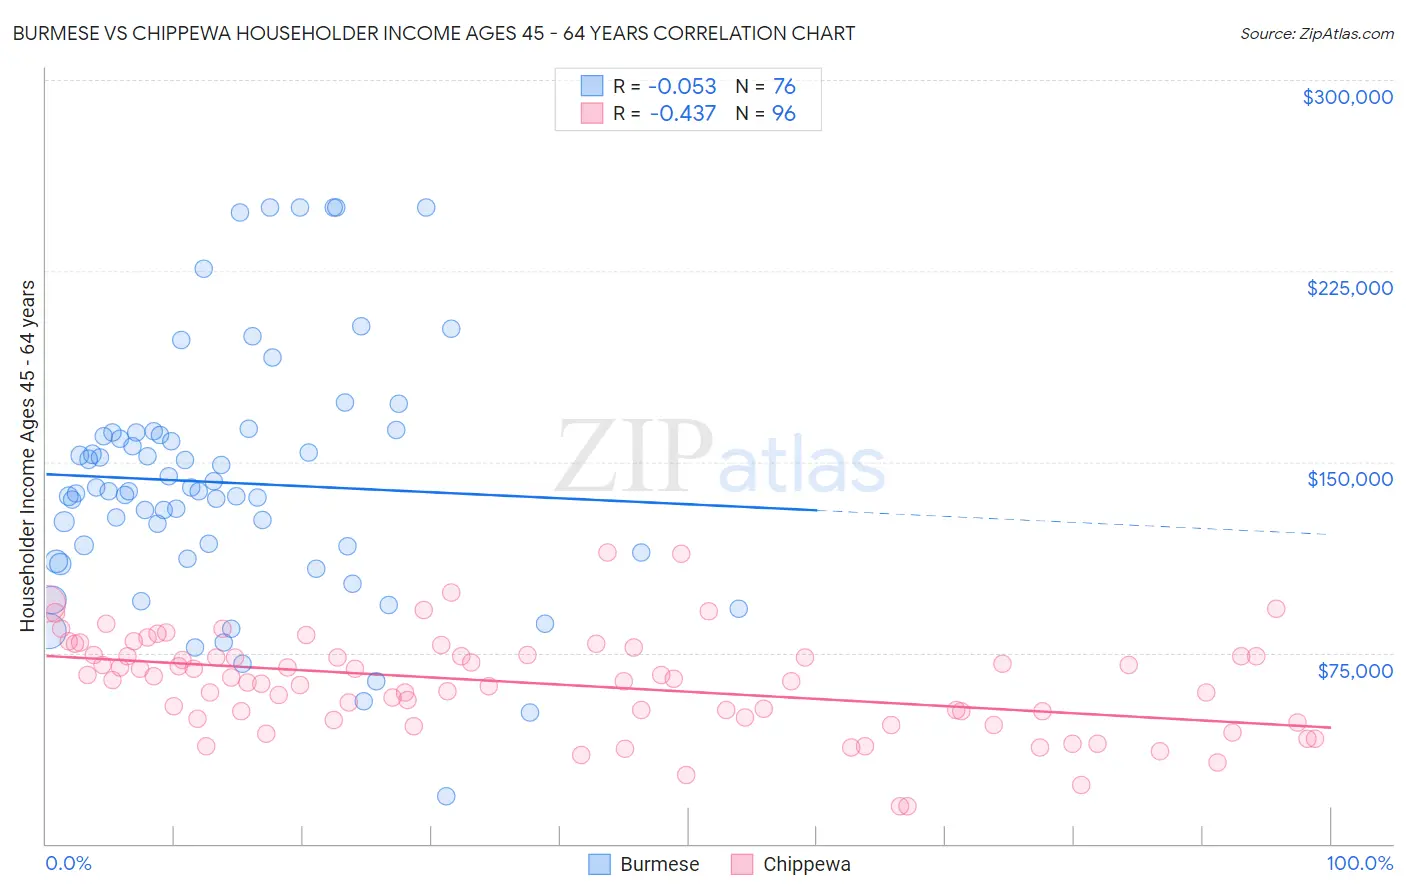
Burmese vs Chippewa Householder Income Ages 45 - 64 years Correlation Chart
The statistical analysis conducted on geographies consisting of 464,084,220 people shows a slight negative correlation between the proportion of Burmese and household income with householder between the ages 45 and 64 in the United States with a correlation coefficient (R) of -0.053 and weighted average of $121,444. Similarly, the statistical analysis conducted on geographies consisting of 214,822,220 people shows a moderate negative correlation between the proportion of Chippewa and household income with householder between the ages 45 and 64 in the United States with a correlation coefficient (R) of -0.437 and weighted average of $83,943, a difference of 44.7%.
Householder Income Ages 45 - 64 years Correlation Summary
| Measurement | Burmese | Chippewa |
| Minimum | $18,640 | $14,500 |
| Maximum | $250,001 | $114,293 |
| Range | $231,361 | $99,793 |
| Mean | $141,791 | $62,889 |
| Median | $138,461 | $64,689 |
| Interquartile 25% (IQ1) | $113,099 | $49,307 |
| Interquartile 75% (IQ3) | $160,979 | $73,755 |
| Interquartile Range (IQR) | $47,880 | $24,448 |
| Standard Deviation (Sample) | $48,701 | $19,427 |
| Standard Deviation (Population) | $48,379 | $19,326 |
Similar Demographics by Householder Income Ages 45 - 64 years
Demographics Similar to Burmese by Householder Income Ages 45 - 64 years
In terms of householder income ages 45 - 64 years, the demographic groups most similar to Burmese are Immigrants from Korea ($121,243, a difference of 0.17%), Immigrants from China ($122,178, a difference of 0.60%), Eastern European ($120,684, a difference of 0.63%), Immigrants from Eastern Asia ($122,222, a difference of 0.64%), and Indian (Asian) ($122,343, a difference of 0.74%).
| Demographics | Rating | Rank | Householder Income Ages 45 - 64 years |
| Immigrants | South Central Asia | 100.0 /100 | #10 | Exceptional $124,188 |
| Cypriots | 100.0 /100 | #11 | Exceptional $123,396 |
| Immigrants | Israel | 100.0 /100 | #12 | Exceptional $122,893 |
| Immigrants | Ireland | 100.0 /100 | #13 | Exceptional $122,757 |
| Indians (Asian) | 100.0 /100 | #14 | Exceptional $122,343 |
| Immigrants | Eastern Asia | 100.0 /100 | #15 | Exceptional $122,222 |
| Immigrants | China | 100.0 /100 | #16 | Exceptional $122,178 |
| Burmese | 100.0 /100 | #17 | Exceptional $121,444 |
| Immigrants | Korea | 100.0 /100 | #18 | Exceptional $121,243 |
| Eastern Europeans | 100.0 /100 | #19 | Exceptional $120,684 |
| Immigrants | Australia | 100.0 /100 | #20 | Exceptional $119,308 |
| Immigrants | Sri Lanka | 100.0 /100 | #21 | Exceptional $119,094 |
| Immigrants | Belgium | 100.0 /100 | #22 | Exceptional $118,932 |
| Bolivians | 100.0 /100 | #23 | Exceptional $118,871 |
| Immigrants | Japan | 100.0 /100 | #24 | Exceptional $118,498 |
Demographics Similar to Chippewa by Householder Income Ages 45 - 64 years
In terms of householder income ages 45 - 64 years, the demographic groups most similar to Chippewa are Ottawa ($83,953, a difference of 0.010%), Ute ($83,937, a difference of 0.010%), Honduran ($84,079, a difference of 0.16%), Shoshone ($83,588, a difference of 0.43%), and Immigrants from Cabo Verde ($83,542, a difference of 0.48%).
| Demographics | Rating | Rank | Householder Income Ages 45 - 64 years |
| Africans | 0.0 /100 | #298 | Tragic $84,925 |
| Immigrants | Mexico | 0.0 /100 | #299 | Tragic $84,910 |
| Indonesians | 0.0 /100 | #300 | Tragic $84,890 |
| Potawatomi | 0.0 /100 | #301 | Tragic $84,613 |
| Haitians | 0.0 /100 | #302 | Tragic $84,384 |
| Hondurans | 0.0 /100 | #303 | Tragic $84,079 |
| Ottawa | 0.0 /100 | #304 | Tragic $83,953 |
| Chippewa | 0.0 /100 | #305 | Tragic $83,943 |
| Ute | 0.0 /100 | #306 | Tragic $83,937 |
| Shoshone | 0.0 /100 | #307 | Tragic $83,588 |
| Immigrants | Cabo Verde | 0.0 /100 | #308 | Tragic $83,542 |
| Immigrants | Dominica | 0.0 /100 | #309 | Tragic $83,311 |
| Immigrants | Haiti | 0.0 /100 | #310 | Tragic $83,257 |
| Immigrants | Bahamas | 0.0 /100 | #311 | Tragic $83,177 |
| Cajuns | 0.0 /100 | #312 | Tragic $83,015 |