Burmese vs Immigrants from Grenada Professional Degree
COMPARE
Burmese
Immigrants from Grenada
Professional Degree
Professional Degree Comparison
Burmese
Immigrants from Grenada
6.1%
PROFESSIONAL DEGREE
100.0/ 100
METRIC RATING
33rd/ 347
METRIC RANK
3.7%
PROFESSIONAL DEGREE
1.5/ 100
METRIC RATING
249th/ 347
METRIC RANK
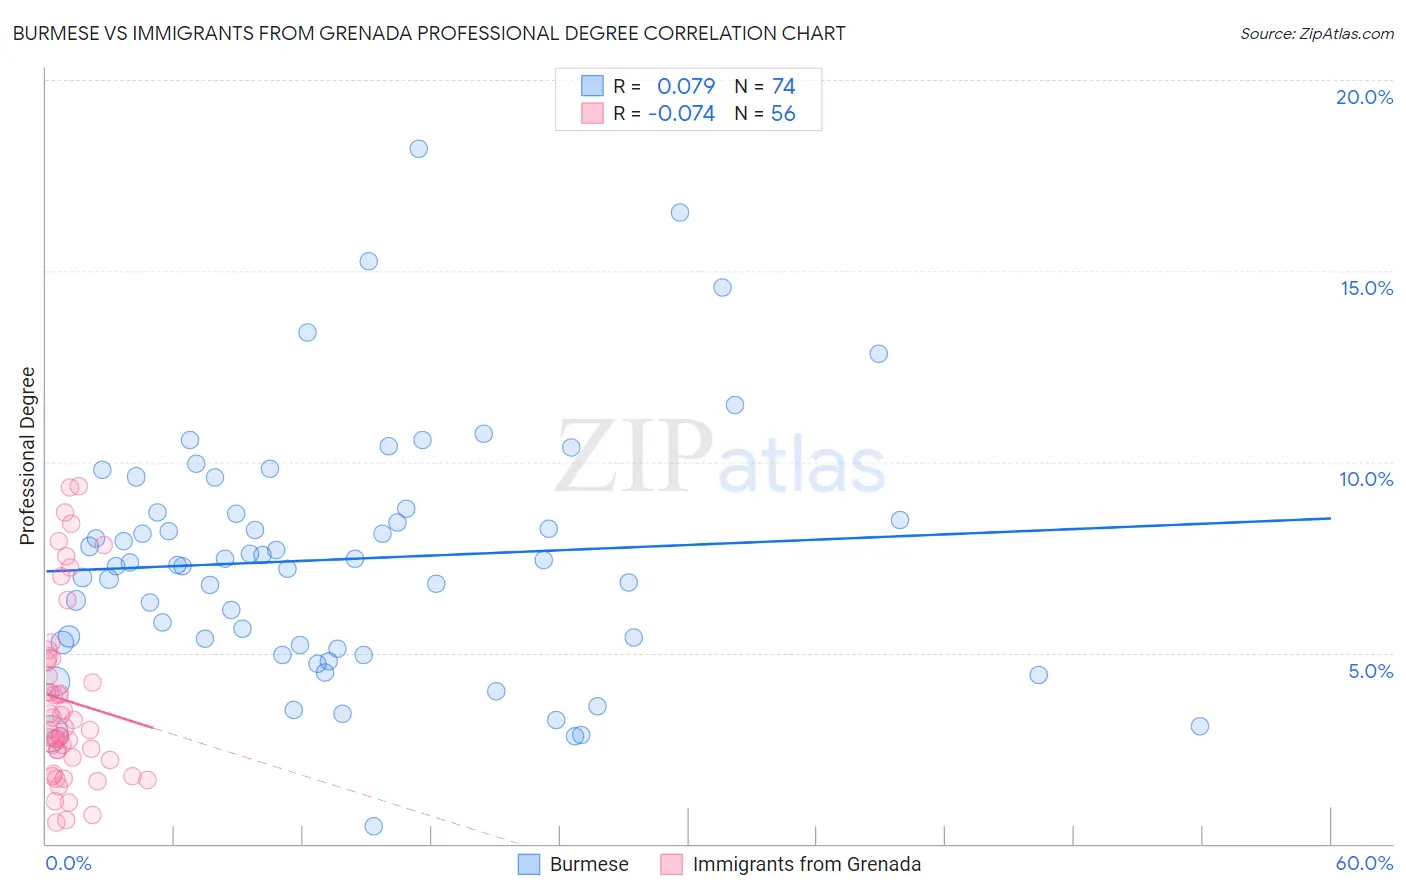
Burmese vs Immigrants from Grenada Professional Degree Correlation Chart
The statistical analysis conducted on geographies consisting of 463,932,708 people shows a slight positive correlation between the proportion of Burmese and percentage of population with at least professional degree education in the United States with a correlation coefficient (R) of 0.079 and weighted average of 6.1%. Similarly, the statistical analysis conducted on geographies consisting of 67,193,029 people shows a slight negative correlation between the proportion of Immigrants from Grenada and percentage of population with at least professional degree education in the United States with a correlation coefficient (R) of -0.074 and weighted average of 3.7%, a difference of 64.2%.
Professional Degree Correlation Summary
| Measurement | Burmese | Immigrants from Grenada |
| Minimum | 0.47% | 0.57% |
| Maximum | 18.2% | 9.4% |
| Range | 17.7% | 8.8% |
| Mean | 7.5% | 3.7% |
| Median | 7.3% | 3.0% |
| Interquartile 25% (IQ1) | 5.2% | 2.2% |
| Interquartile 75% (IQ3) | 8.7% | 4.8% |
| Interquartile Range (IQR) | 3.5% | 2.6% |
| Standard Deviation (Sample) | 3.3% | 2.3% |
| Standard Deviation (Population) | 3.2% | 2.3% |
Similar Demographics by Professional Degree
Demographics Similar to Burmese by Professional Degree
In terms of professional degree, the demographic groups most similar to Burmese are Thai (6.1%, a difference of 0.030%), Mongolian (6.1%, a difference of 0.13%), Immigrants from India (6.2%, a difference of 0.27%), Immigrants from Sri Lanka (6.2%, a difference of 0.39%), and Immigrants from Turkey (6.2%, a difference of 0.39%).
| Demographics | Rating | Rank | Professional Degree |
| Latvians | 100.0 /100 | #26 | Exceptional 6.2% |
| Immigrants | Northern Europe | 100.0 /100 | #27 | Exceptional 6.2% |
| Turks | 100.0 /100 | #28 | Exceptional 6.2% |
| Immigrants | Sri Lanka | 100.0 /100 | #29 | Exceptional 6.2% |
| Immigrants | Turkey | 100.0 /100 | #30 | Exceptional 6.2% |
| Immigrants | India | 100.0 /100 | #31 | Exceptional 6.2% |
| Thais | 100.0 /100 | #32 | Exceptional 6.1% |
| Burmese | 100.0 /100 | #33 | Exceptional 6.1% |
| Mongolians | 100.0 /100 | #34 | Exceptional 6.1% |
| Immigrants | Korea | 100.0 /100 | #35 | Exceptional 6.1% |
| Immigrants | Russia | 100.0 /100 | #36 | Exceptional 6.0% |
| Immigrants | Austria | 100.0 /100 | #37 | Exceptional 6.0% |
| Immigrants | Norway | 100.0 /100 | #38 | Exceptional 6.0% |
| Immigrants | South Africa | 100.0 /100 | #39 | Exceptional 6.0% |
| Cambodians | 100.0 /100 | #40 | Exceptional 6.0% |
Demographics Similar to Immigrants from Grenada by Professional Degree
In terms of professional degree, the demographic groups most similar to Immigrants from Grenada are Immigrants from Fiji (3.7%, a difference of 0.060%), Hmong (3.7%, a difference of 0.11%), Guyanese (3.8%, a difference of 0.27%), Marshallese (3.8%, a difference of 0.30%), and Immigrants from Nicaragua (3.7%, a difference of 0.31%).
| Demographics | Rating | Rank | Professional Degree |
| Native Hawaiians | 2.3 /100 | #242 | Tragic 3.8% |
| Guamanians/Chamorros | 2.2 /100 | #243 | Tragic 3.8% |
| Immigrants | Bahamas | 2.0 /100 | #244 | Tragic 3.8% |
| French American Indians | 1.7 /100 | #245 | Tragic 3.8% |
| Marshallese | 1.7 /100 | #246 | Tragic 3.8% |
| Guyanese | 1.6 /100 | #247 | Tragic 3.8% |
| Hmong | 1.6 /100 | #248 | Tragic 3.7% |
| Immigrants | Grenada | 1.5 /100 | #249 | Tragic 3.7% |
| Immigrants | Fiji | 1.5 /100 | #250 | Tragic 3.7% |
| Immigrants | Nicaragua | 1.4 /100 | #251 | Tragic 3.7% |
| Jamaicans | 1.4 /100 | #252 | Tragic 3.7% |
| Pueblo | 1.4 /100 | #253 | Tragic 3.7% |
| Tongans | 1.3 /100 | #254 | Tragic 3.7% |
| Osage | 1.2 /100 | #255 | Tragic 3.7% |
| Iroquois | 1.2 /100 | #256 | Tragic 3.7% |