Burmese vs Hawaiian Median Female Earnings
COMPARE
Burmese
Hawaiian
Median Female Earnings
Median Female Earnings Comparison
Burmese
Hawaiians
$44,911
MEDIAN FEMALE EARNINGS
100.0/ 100
METRIC RATING
23rd/ 347
METRIC RANK
$37,497
MEDIAN FEMALE EARNINGS
1.0/ 100
METRIC RATING
257th/ 347
METRIC RANK
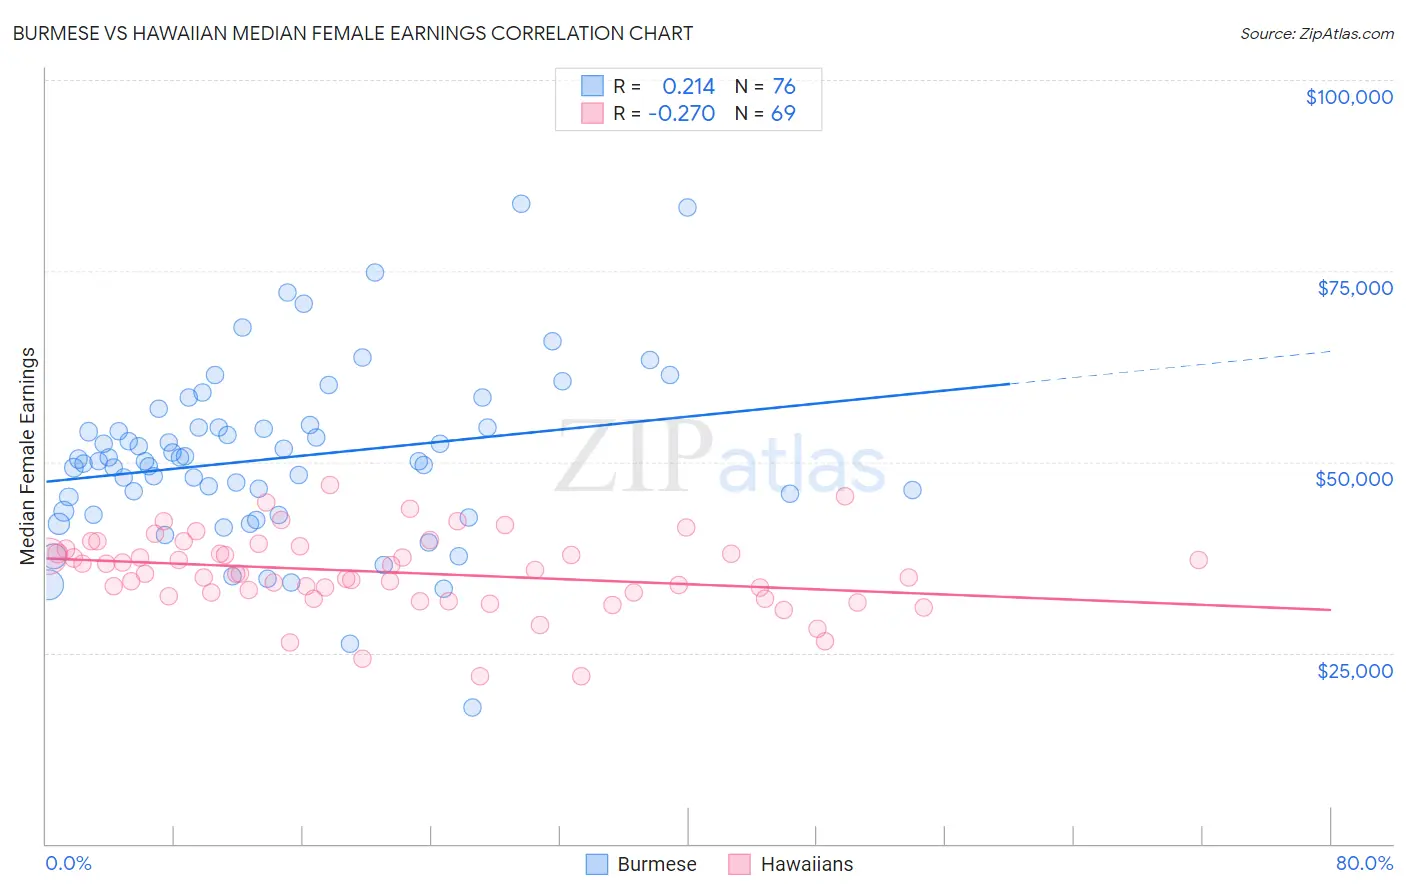
Burmese vs Hawaiian Median Female Earnings Correlation Chart
The statistical analysis conducted on geographies consisting of 465,115,174 people shows a weak positive correlation between the proportion of Burmese and median female earnings in the United States with a correlation coefficient (R) of 0.214 and weighted average of $44,911. Similarly, the statistical analysis conducted on geographies consisting of 327,459,895 people shows a weak negative correlation between the proportion of Hawaiians and median female earnings in the United States with a correlation coefficient (R) of -0.270 and weighted average of $37,497, a difference of 19.8%.
Median Female Earnings Correlation Summary
| Measurement | Burmese | Hawaiian |
| Minimum | $17,769 | $21,870 |
| Maximum | $83,750 | $46,893 |
| Range | $65,981 | $25,022 |
| Mean | $50,485 | $35,548 |
| Median | $50,131 | $35,373 |
| Interquartile 25% (IQ1) | $43,337 | $32,654 |
| Interquartile 75% (IQ3) | $54,499 | $38,788 |
| Interquartile Range (IQR) | $11,162 | $6,134 |
| Standard Deviation (Sample) | $11,391 | $5,103 |
| Standard Deviation (Population) | $11,316 | $5,066 |
Similar Demographics by Median Female Earnings
Demographics Similar to Burmese by Median Female Earnings
In terms of median female earnings, the demographic groups most similar to Burmese are Immigrants from Greece ($44,976, a difference of 0.14%), Immigrants from Korea ($44,847, a difference of 0.14%), Cambodian ($45,014, a difference of 0.23%), Immigrants from Sweden ($44,774, a difference of 0.31%), and Immigrants from Belarus ($44,757, a difference of 0.34%).
| Demographics | Rating | Rank | Median Female Earnings |
| Indians (Asian) | 100.0 /100 | #16 | Exceptional $46,481 |
| Immigrants | South Central Asia | 100.0 /100 | #17 | Exceptional $46,324 |
| Cypriots | 100.0 /100 | #18 | Exceptional $45,570 |
| Eastern Europeans | 100.0 /100 | #19 | Exceptional $45,385 |
| Immigrants | Japan | 100.0 /100 | #20 | Exceptional $45,323 |
| Cambodians | 100.0 /100 | #21 | Exceptional $45,014 |
| Immigrants | Greece | 100.0 /100 | #22 | Exceptional $44,976 |
| Burmese | 100.0 /100 | #23 | Exceptional $44,911 |
| Immigrants | Korea | 100.0 /100 | #24 | Exceptional $44,847 |
| Immigrants | Sweden | 100.0 /100 | #25 | Exceptional $44,774 |
| Immigrants | Belarus | 100.0 /100 | #26 | Exceptional $44,757 |
| Turks | 100.0 /100 | #27 | Exceptional $44,695 |
| Immigrants | Russia | 100.0 /100 | #28 | Exceptional $44,680 |
| Immigrants | Belgium | 100.0 /100 | #29 | Exceptional $44,587 |
| Asians | 100.0 /100 | #30 | Exceptional $44,586 |
Demographics Similar to Hawaiians by Median Female Earnings
In terms of median female earnings, the demographic groups most similar to Hawaiians are Samoan ($37,498, a difference of 0.0%), Colville ($37,514, a difference of 0.040%), White/Caucasian ($37,531, a difference of 0.090%), Belizean ($37,429, a difference of 0.18%), and Scotch-Irish ($37,383, a difference of 0.31%).
| Demographics | Rating | Rank | Median Female Earnings |
| Immigrants | Iraq | 2.2 /100 | #250 | Tragic $37,864 |
| Welsh | 2.1 /100 | #251 | Tragic $37,856 |
| Immigrants | Dominica | 2.0 /100 | #252 | Tragic $37,825 |
| Danes | 1.6 /100 | #253 | Tragic $37,730 |
| Whites/Caucasians | 1.1 /100 | #254 | Tragic $37,531 |
| Colville | 1.1 /100 | #255 | Tragic $37,514 |
| Samoans | 1.0 /100 | #256 | Tragic $37,498 |
| Hawaiians | 1.0 /100 | #257 | Tragic $37,497 |
| Belizeans | 0.9 /100 | #258 | Tragic $37,429 |
| Scotch-Irish | 0.8 /100 | #259 | Tragic $37,383 |
| Dutch | 0.7 /100 | #260 | Tragic $37,339 |
| Malaysians | 0.7 /100 | #261 | Tragic $37,298 |
| Venezuelans | 0.7 /100 | #262 | Tragic $37,282 |
| German Russians | 0.5 /100 | #263 | Tragic $37,105 |
| Salvadorans | 0.4 /100 | #264 | Tragic $37,083 |