Bulgarian vs Cherokee Householder Income Ages 45 - 64 years
COMPARE
Bulgarian
Cherokee
Householder Income Ages 45 - 64 years
Householder Income Ages 45 - 64 years Comparison
Bulgarians
Cherokee
$113,883
HOUSEHOLDER INCOME AGES 45 - 64 YEARS
99.9/ 100
METRIC RATING
44th/ 347
METRIC RANK
$86,125
HOUSEHOLDER INCOME AGES 45 - 64 YEARS
0.1/ 100
METRIC RATING
290th/ 347
METRIC RANK
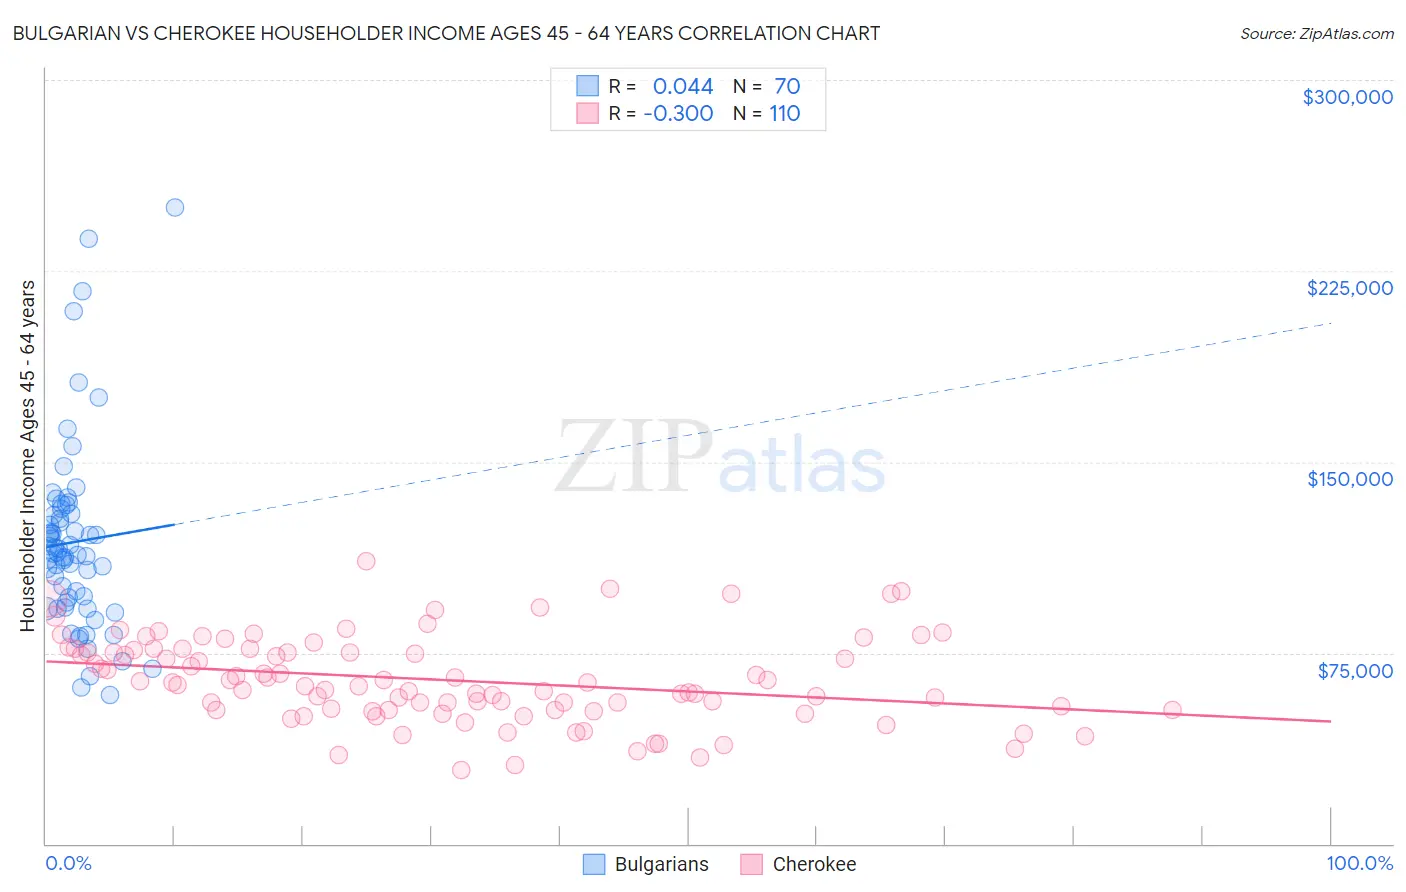
Bulgarian vs Cherokee Householder Income Ages 45 - 64 years Correlation Chart
The statistical analysis conducted on geographies consisting of 205,498,500 people shows no correlation between the proportion of Bulgarians and household income with householder between the ages 45 and 64 in the United States with a correlation coefficient (R) of 0.044 and weighted average of $113,883. Similarly, the statistical analysis conducted on geographies consisting of 491,799,921 people shows a mild negative correlation between the proportion of Cherokee and household income with householder between the ages 45 and 64 in the United States with a correlation coefficient (R) of -0.300 and weighted average of $86,125, a difference of 32.2%.
Householder Income Ages 45 - 64 years Correlation Summary
| Measurement | Bulgarian | Cherokee |
| Minimum | $58,365 | $29,177 |
| Maximum | $250,001 | $110,921 |
| Range | $191,636 | $81,743 |
| Mean | $118,506 | $64,277 |
| Median | $114,293 | $62,715 |
| Interquartile 25% (IQ1) | $94,899 | $52,500 |
| Interquartile 75% (IQ3) | $129,526 | $76,245 |
| Interquartile Range (IQR) | $34,627 | $23,745 |
| Standard Deviation (Sample) | $36,891 | $16,781 |
| Standard Deviation (Population) | $36,627 | $16,705 |
Similar Demographics by Householder Income Ages 45 - 64 years
Demographics Similar to Bulgarians by Householder Income Ages 45 - 64 years
In terms of householder income ages 45 - 64 years, the demographic groups most similar to Bulgarians are Immigrants from France ($113,680, a difference of 0.18%), Israeli ($114,186, a difference of 0.27%), Immigrants from Greece ($113,548, a difference of 0.29%), Estonian ($114,220, a difference of 0.30%), and Australian ($113,533, a difference of 0.31%).
| Demographics | Rating | Rank | Householder Income Ages 45 - 64 years |
| Maltese | 99.9 /100 | #37 | Exceptional $114,754 |
| Immigrants | Pakistan | 99.9 /100 | #38 | Exceptional $114,434 |
| Immigrants | Turkey | 99.9 /100 | #39 | Exceptional $114,407 |
| Cambodians | 99.9 /100 | #40 | Exceptional $114,342 |
| Immigrants | Lithuania | 99.9 /100 | #41 | Exceptional $114,336 |
| Estonians | 99.9 /100 | #42 | Exceptional $114,220 |
| Israelis | 99.9 /100 | #43 | Exceptional $114,186 |
| Bulgarians | 99.9 /100 | #44 | Exceptional $113,883 |
| Immigrants | France | 99.9 /100 | #45 | Exceptional $113,680 |
| Immigrants | Greece | 99.9 /100 | #46 | Exceptional $113,548 |
| Australians | 99.9 /100 | #47 | Exceptional $113,533 |
| Immigrants | Indonesia | 99.9 /100 | #48 | Exceptional $113,519 |
| Immigrants | Russia | 99.8 /100 | #49 | Exceptional $113,215 |
| Immigrants | Austria | 99.8 /100 | #50 | Exceptional $113,140 |
| Immigrants | South Africa | 99.8 /100 | #51 | Exceptional $112,886 |
Demographics Similar to Cherokee by Householder Income Ages 45 - 64 years
In terms of householder income ages 45 - 64 years, the demographic groups most similar to Cherokee are Hispanic or Latino ($86,006, a difference of 0.14%), Immigrants from Central America ($85,965, a difference of 0.19%), Cuban ($86,301, a difference of 0.20%), Immigrants from St. Vincent and the Grenadines ($86,394, a difference of 0.31%), and Bangladeshi ($86,402, a difference of 0.32%).
| Demographics | Rating | Rank | Householder Income Ages 45 - 64 years |
| Mexicans | 0.1 /100 | #283 | Tragic $86,816 |
| Central American Indians | 0.1 /100 | #284 | Tragic $86,764 |
| Blackfeet | 0.1 /100 | #285 | Tragic $86,595 |
| Immigrants | Guatemala | 0.1 /100 | #286 | Tragic $86,573 |
| Bangladeshis | 0.1 /100 | #287 | Tragic $86,402 |
| Immigrants | St. Vincent and the Grenadines | 0.1 /100 | #288 | Tragic $86,394 |
| Cubans | 0.1 /100 | #289 | Tragic $86,301 |
| Cherokee | 0.1 /100 | #290 | Tragic $86,125 |
| Hispanics or Latinos | 0.1 /100 | #291 | Tragic $86,006 |
| Immigrants | Central America | 0.1 /100 | #292 | Tragic $85,965 |
| Comanche | 0.1 /100 | #293 | Tragic $85,787 |
| British West Indians | 0.1 /100 | #294 | Tragic $85,571 |
| Immigrants | Grenada | 0.1 /100 | #295 | Tragic $85,552 |
| Immigrants | Zaire | 0.1 /100 | #296 | Tragic $85,207 |
| Fijians | 0.1 /100 | #297 | Tragic $85,187 |