Albanian vs Okinawan Householder Income Ages 45 - 64 years
COMPARE
Albanian
Okinawan
Householder Income Ages 45 - 64 years
Householder Income Ages 45 - 64 years Comparison
Albanians
Okinawans
$106,243
HOUSEHOLDER INCOME AGES 45 - 64 YEARS
95.1/ 100
METRIC RATING
117th/ 347
METRIC RANK
$124,796
HOUSEHOLDER INCOME AGES 45 - 64 YEARS
100.0/ 100
METRIC RATING
9th/ 347
METRIC RANK
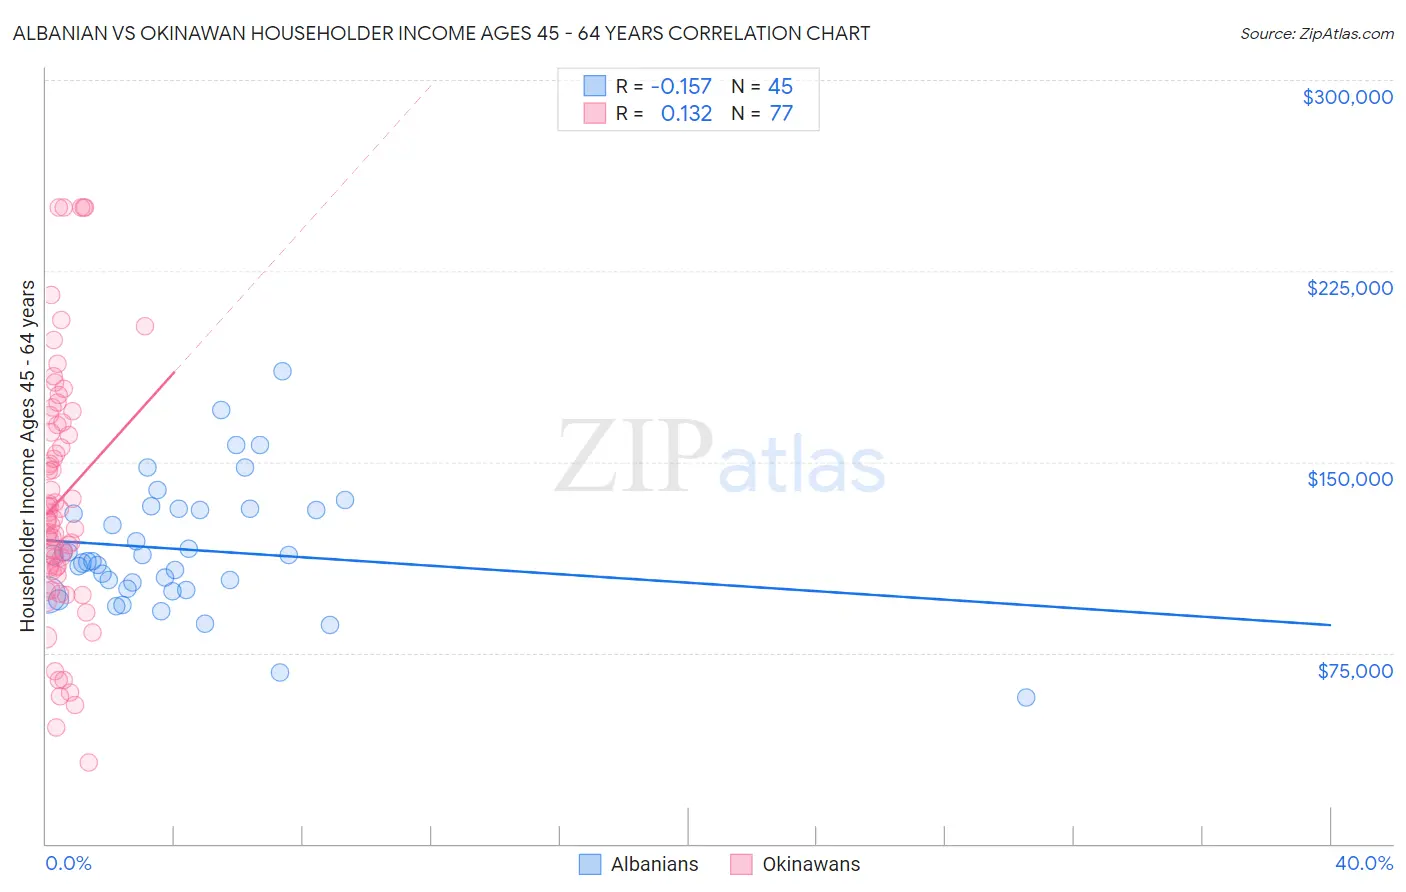
Albanian vs Okinawan Householder Income Ages 45 - 64 years Correlation Chart
The statistical analysis conducted on geographies consisting of 193,108,072 people shows a poor negative correlation between the proportion of Albanians and household income with householder between the ages 45 and 64 in the United States with a correlation coefficient (R) of -0.157 and weighted average of $106,243. Similarly, the statistical analysis conducted on geographies consisting of 73,700,687 people shows a poor positive correlation between the proportion of Okinawans and household income with householder between the ages 45 and 64 in the United States with a correlation coefficient (R) of 0.132 and weighted average of $124,796, a difference of 17.5%.
Householder Income Ages 45 - 64 years Correlation Summary
| Measurement | Albanian | Okinawan |
| Minimum | $57,692 | $31,848 |
| Maximum | $185,625 | $250,001 |
| Range | $127,933 | $218,153 |
| Mean | $115,620 | $135,211 |
| Median | $111,029 | $127,491 |
| Interquartile 25% (IQ1) | $99,857 | $107,731 |
| Interquartile 75% (IQ3) | $131,426 | $164,928 |
| Interquartile Range (IQR) | $31,568 | $57,197 |
| Standard Deviation (Sample) | $24,903 | $49,050 |
| Standard Deviation (Population) | $24,625 | $48,731 |
Similar Demographics by Householder Income Ages 45 - 64 years
Demographics Similar to Albanians by Householder Income Ages 45 - 64 years
In terms of householder income ages 45 - 64 years, the demographic groups most similar to Albanians are British ($106,264, a difference of 0.020%), Immigrants from Western Asia ($106,217, a difference of 0.020%), Immigrants from Kuwait ($106,285, a difference of 0.040%), Immigrants from Poland ($106,319, a difference of 0.070%), and Immigrants from Jordan ($106,164, a difference of 0.070%).
| Demographics | Rating | Rank | Householder Income Ages 45 - 64 years |
| Immigrants | Brazil | 95.6 /100 | #110 | Exceptional $106,470 |
| Immigrants | Vietnam | 95.5 /100 | #111 | Exceptional $106,417 |
| Swedes | 95.4 /100 | #112 | Exceptional $106,377 |
| Europeans | 95.4 /100 | #113 | Exceptional $106,367 |
| Immigrants | Poland | 95.3 /100 | #114 | Exceptional $106,319 |
| Immigrants | Kuwait | 95.2 /100 | #115 | Exceptional $106,285 |
| British | 95.2 /100 | #116 | Exceptional $106,264 |
| Albanians | 95.1 /100 | #117 | Exceptional $106,243 |
| Immigrants | Western Asia | 95.0 /100 | #118 | Exceptional $106,217 |
| Immigrants | Jordan | 94.9 /100 | #119 | Exceptional $106,164 |
| Immigrants | South Eastern Asia | 94.8 /100 | #120 | Exceptional $106,109 |
| Poles | 94.4 /100 | #121 | Exceptional $105,952 |
| Immigrants | North Macedonia | 94.2 /100 | #122 | Exceptional $105,892 |
| Danes | 93.4 /100 | #123 | Exceptional $105,619 |
| Immigrants | Northern Africa | 92.8 /100 | #124 | Exceptional $105,430 |
Demographics Similar to Okinawans by Householder Income Ages 45 - 64 years
In terms of householder income ages 45 - 64 years, the demographic groups most similar to Okinawans are Immigrants from South Central Asia ($124,188, a difference of 0.49%), Cypriot ($123,396, a difference of 1.1%), Immigrants from Israel ($122,893, a difference of 1.5%), Immigrants from Ireland ($122,757, a difference of 1.7%), and Immigrants from Iran ($126,940, a difference of 1.7%).
| Demographics | Rating | Rank | Householder Income Ages 45 - 64 years |
| Filipinos | 100.0 /100 | #2 | Exceptional $134,910 |
| Immigrants | India | 100.0 /100 | #3 | Exceptional $132,488 |
| Thais | 100.0 /100 | #4 | Exceptional $129,560 |
| Immigrants | Singapore | 100.0 /100 | #5 | Exceptional $129,514 |
| Iranians | 100.0 /100 | #6 | Exceptional $129,350 |
| Immigrants | Hong Kong | 100.0 /100 | #7 | Exceptional $127,500 |
| Immigrants | Iran | 100.0 /100 | #8 | Exceptional $126,940 |
| Okinawans | 100.0 /100 | #9 | Exceptional $124,796 |
| Immigrants | South Central Asia | 100.0 /100 | #10 | Exceptional $124,188 |
| Cypriots | 100.0 /100 | #11 | Exceptional $123,396 |
| Immigrants | Israel | 100.0 /100 | #12 | Exceptional $122,893 |
| Immigrants | Ireland | 100.0 /100 | #13 | Exceptional $122,757 |
| Indians (Asian) | 100.0 /100 | #14 | Exceptional $122,343 |
| Immigrants | Eastern Asia | 100.0 /100 | #15 | Exceptional $122,222 |
| Immigrants | China | 100.0 /100 | #16 | Exceptional $122,178 |