Menominee vs Okinawan Householder Income Ages 45 - 64 years
COMPARE
Menominee
Okinawan
Householder Income Ages 45 - 64 years
Householder Income Ages 45 - 64 years Comparison
Menominee
Okinawans
$76,903
HOUSEHOLDER INCOME AGES 45 - 64 YEARS
0.0/ 100
METRIC RATING
334th/ 347
METRIC RANK
$124,796
HOUSEHOLDER INCOME AGES 45 - 64 YEARS
100.0/ 100
METRIC RATING
9th/ 347
METRIC RANK
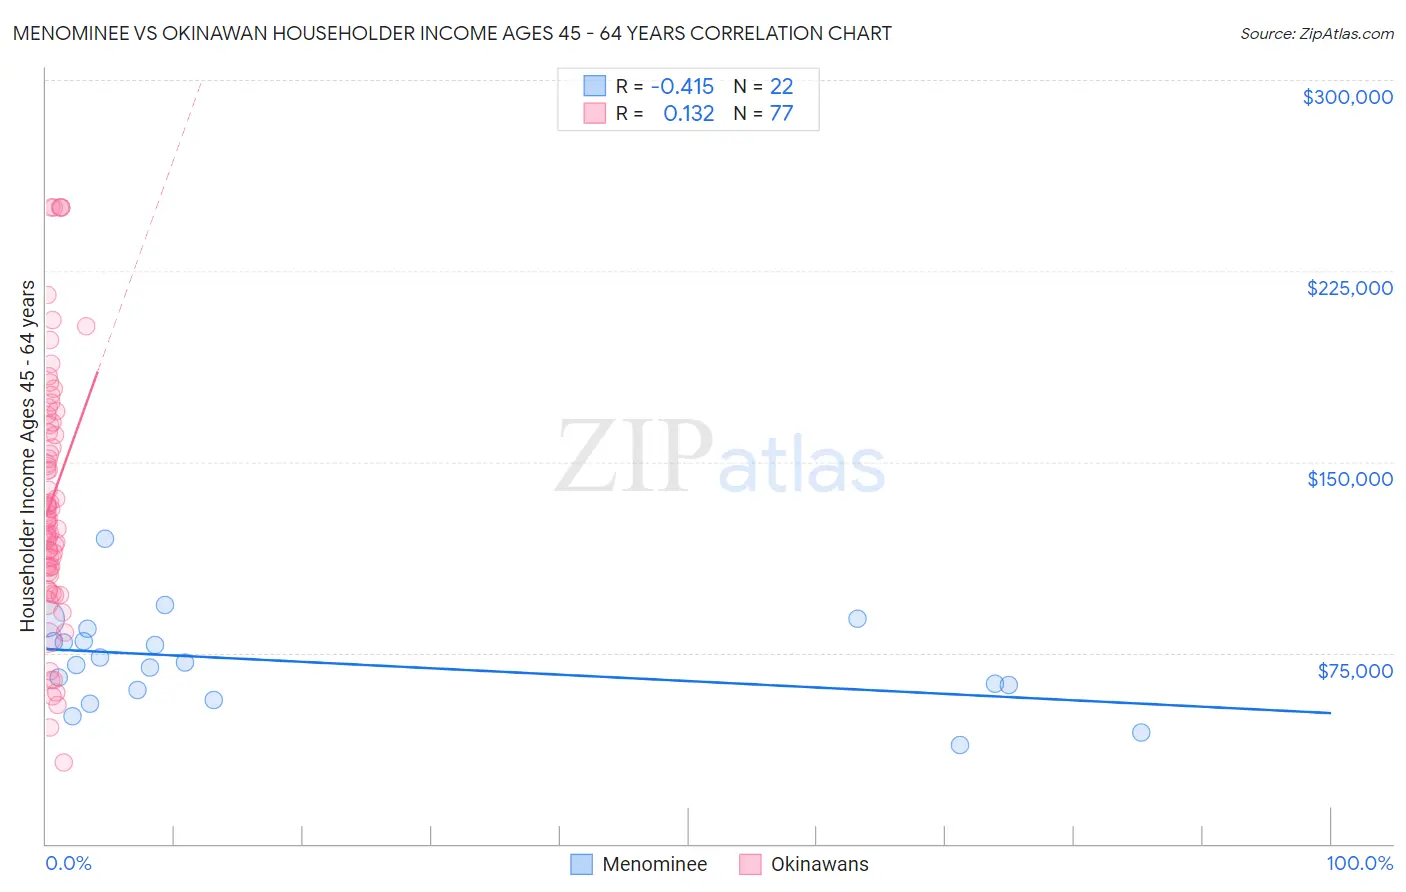
Menominee vs Okinawan Householder Income Ages 45 - 64 years Correlation Chart
The statistical analysis conducted on geographies consisting of 45,774,690 people shows a moderate negative correlation between the proportion of Menominee and household income with householder between the ages 45 and 64 in the United States with a correlation coefficient (R) of -0.415 and weighted average of $76,903. Similarly, the statistical analysis conducted on geographies consisting of 73,700,687 people shows a poor positive correlation between the proportion of Okinawans and household income with householder between the ages 45 and 64 in the United States with a correlation coefficient (R) of 0.132 and weighted average of $124,796, a difference of 62.3%.
Householder Income Ages 45 - 64 years Correlation Summary
| Measurement | Menominee | Okinawan |
| Minimum | $38,750 | $31,848 |
| Maximum | $119,583 | $250,001 |
| Range | $80,833 | $218,153 |
| Mean | $71,291 | $135,211 |
| Median | $70,827 | $127,491 |
| Interquartile 25% (IQ1) | $60,417 | $107,731 |
| Interquartile 75% (IQ3) | $79,440 | $164,928 |
| Interquartile Range (IQR) | $19,023 | $57,197 |
| Standard Deviation (Sample) | $18,138 | $49,050 |
| Standard Deviation (Population) | $17,721 | $48,731 |
Similar Demographics by Householder Income Ages 45 - 64 years
Demographics Similar to Menominee by Householder Income Ages 45 - 64 years
In terms of householder income ages 45 - 64 years, the demographic groups most similar to Menominee are Cheyenne ($76,362, a difference of 0.71%), Immigrants from Congo ($77,850, a difference of 1.2%), Arapaho ($75,945, a difference of 1.3%), Pueblo ($75,601, a difference of 1.7%), and Hopi ($75,562, a difference of 1.8%).
| Demographics | Rating | Rank | Householder Income Ages 45 - 64 years |
| Seminole | 0.0 /100 | #327 | Tragic $80,077 |
| Natives/Alaskans | 0.0 /100 | #328 | Tragic $79,816 |
| Dutch West Indians | 0.0 /100 | #329 | Tragic $79,171 |
| Creek | 0.0 /100 | #330 | Tragic $78,960 |
| Immigrants | Dominican Republic | 0.0 /100 | #331 | Tragic $78,836 |
| Blacks/African Americans | 0.0 /100 | #332 | Tragic $78,556 |
| Immigrants | Congo | 0.0 /100 | #333 | Tragic $77,850 |
| Menominee | 0.0 /100 | #334 | Tragic $76,903 |
| Cheyenne | 0.0 /100 | #335 | Tragic $76,362 |
| Arapaho | 0.0 /100 | #336 | Tragic $75,945 |
| Pueblo | 0.0 /100 | #337 | Tragic $75,601 |
| Hopi | 0.0 /100 | #338 | Tragic $75,562 |
| Kiowa | 0.0 /100 | #339 | Tragic $74,815 |
| Immigrants | Yemen | 0.0 /100 | #340 | Tragic $74,575 |
| Crow | 0.0 /100 | #341 | Tragic $74,257 |
Demographics Similar to Okinawans by Householder Income Ages 45 - 64 years
In terms of householder income ages 45 - 64 years, the demographic groups most similar to Okinawans are Immigrants from South Central Asia ($124,188, a difference of 0.49%), Cypriot ($123,396, a difference of 1.1%), Immigrants from Israel ($122,893, a difference of 1.5%), Immigrants from Ireland ($122,757, a difference of 1.7%), and Immigrants from Iran ($126,940, a difference of 1.7%).
| Demographics | Rating | Rank | Householder Income Ages 45 - 64 years |
| Filipinos | 100.0 /100 | #2 | Exceptional $134,910 |
| Immigrants | India | 100.0 /100 | #3 | Exceptional $132,488 |
| Thais | 100.0 /100 | #4 | Exceptional $129,560 |
| Immigrants | Singapore | 100.0 /100 | #5 | Exceptional $129,514 |
| Iranians | 100.0 /100 | #6 | Exceptional $129,350 |
| Immigrants | Hong Kong | 100.0 /100 | #7 | Exceptional $127,500 |
| Immigrants | Iran | 100.0 /100 | #8 | Exceptional $126,940 |
| Okinawans | 100.0 /100 | #9 | Exceptional $124,796 |
| Immigrants | South Central Asia | 100.0 /100 | #10 | Exceptional $124,188 |
| Cypriots | 100.0 /100 | #11 | Exceptional $123,396 |
| Immigrants | Israel | 100.0 /100 | #12 | Exceptional $122,893 |
| Immigrants | Ireland | 100.0 /100 | #13 | Exceptional $122,757 |
| Indians (Asian) | 100.0 /100 | #14 | Exceptional $122,343 |
| Immigrants | Eastern Asia | 100.0 /100 | #15 | Exceptional $122,222 |
| Immigrants | China | 100.0 /100 | #16 | Exceptional $122,178 |