Immigrants from Asia vs Okinawan Householder Income Ages 45 - 64 years
COMPARE
Immigrants from Asia
Okinawan
Householder Income Ages 45 - 64 years
Householder Income Ages 45 - 64 years Comparison
Immigrants from Asia
Okinawans
$116,566
HOUSEHOLDER INCOME AGES 45 - 64 YEARS
100.0/ 100
METRIC RATING
31st/ 347
METRIC RANK
$124,796
HOUSEHOLDER INCOME AGES 45 - 64 YEARS
100.0/ 100
METRIC RATING
9th/ 347
METRIC RANK
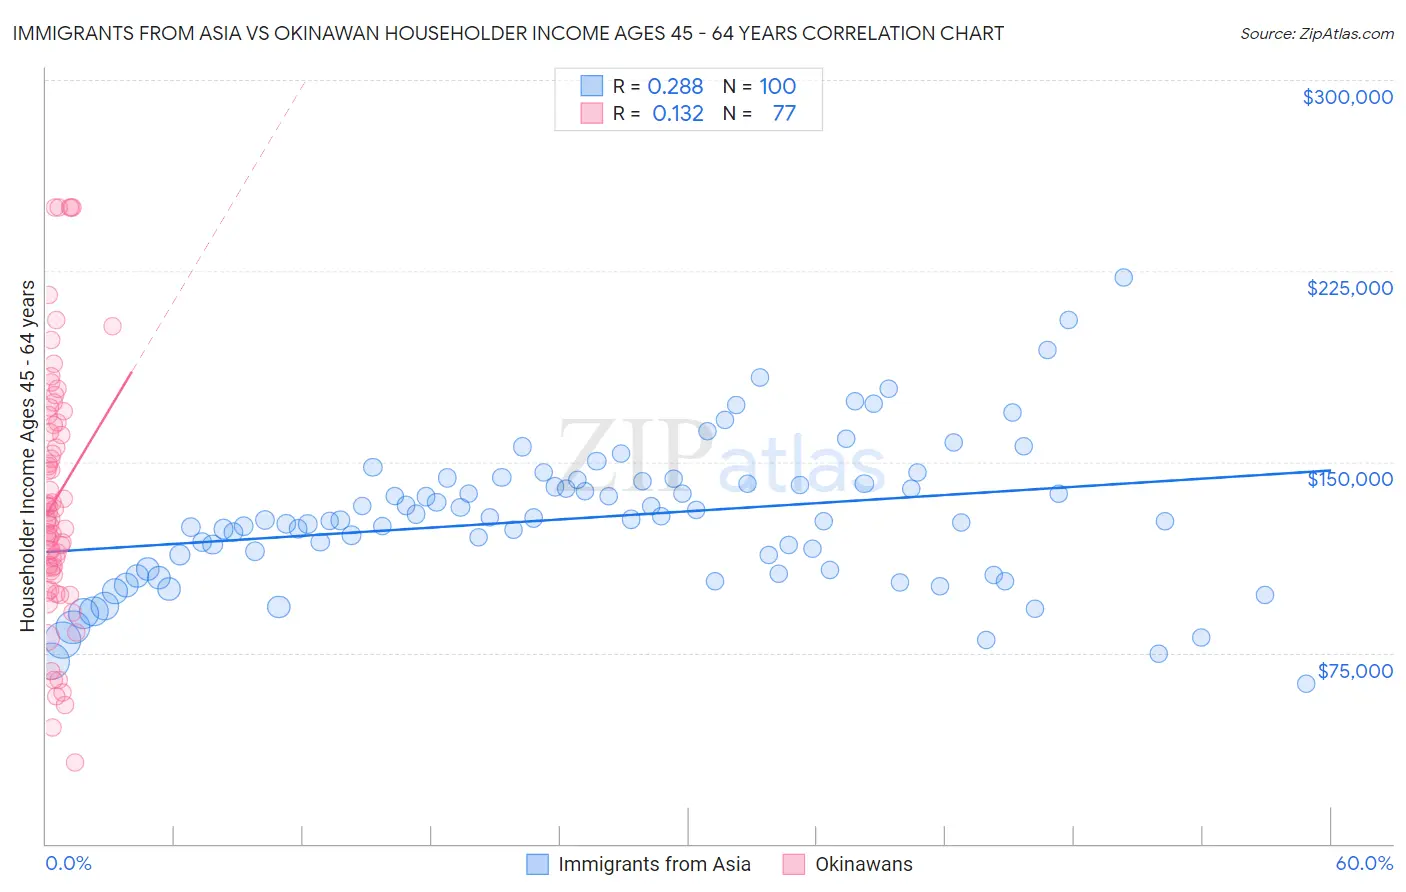
Immigrants from Asia vs Okinawan Householder Income Ages 45 - 64 years Correlation Chart
The statistical analysis conducted on geographies consisting of 546,661,171 people shows a weak positive correlation between the proportion of Immigrants from Asia and household income with householder between the ages 45 and 64 in the United States with a correlation coefficient (R) of 0.288 and weighted average of $116,566. Similarly, the statistical analysis conducted on geographies consisting of 73,700,687 people shows a poor positive correlation between the proportion of Okinawans and household income with householder between the ages 45 and 64 in the United States with a correlation coefficient (R) of 0.132 and weighted average of $124,796, a difference of 7.1%.
Householder Income Ages 45 - 64 years Correlation Summary
| Measurement | Immigrants from Asia | Okinawan |
| Minimum | $62,982 | $31,848 |
| Maximum | $222,452 | $250,001 |
| Range | $159,470 | $218,153 |
| Mean | $128,196 | $135,211 |
| Median | $127,106 | $127,491 |
| Interquartile 25% (IQ1) | $107,795 | $107,731 |
| Interquartile 75% (IQ3) | $142,101 | $164,928 |
| Interquartile Range (IQR) | $34,306 | $57,197 |
| Standard Deviation (Sample) | $28,288 | $49,050 |
| Standard Deviation (Population) | $28,146 | $48,731 |
Similar Demographics by Householder Income Ages 45 - 64 years
Demographics Similar to Immigrants from Asia by Householder Income Ages 45 - 64 years
In terms of householder income ages 45 - 64 years, the demographic groups most similar to Immigrants from Asia are Russian ($116,328, a difference of 0.20%), Chinese ($116,156, a difference of 0.35%), Immigrants from Denmark ($116,000, a difference of 0.49%), Latvian ($115,957, a difference of 0.53%), and Immigrants from Switzerland ($115,934, a difference of 0.54%).
| Demographics | Rating | Rank | Householder Income Ages 45 - 64 years |
| Immigrants | Japan | 100.0 /100 | #24 | Exceptional $118,498 |
| Asians | 100.0 /100 | #25 | Exceptional $118,426 |
| Immigrants | Sweden | 100.0 /100 | #26 | Exceptional $118,318 |
| Immigrants | Northern Europe | 100.0 /100 | #27 | Exceptional $117,930 |
| Turks | 100.0 /100 | #28 | Exceptional $117,814 |
| Bhutanese | 100.0 /100 | #29 | Exceptional $117,750 |
| Immigrants | Bolivia | 100.0 /100 | #30 | Exceptional $117,731 |
| Immigrants | Asia | 100.0 /100 | #31 | Exceptional $116,566 |
| Russians | 100.0 /100 | #32 | Exceptional $116,328 |
| Chinese | 100.0 /100 | #33 | Exceptional $116,156 |
| Immigrants | Denmark | 100.0 /100 | #34 | Exceptional $116,000 |
| Latvians | 100.0 /100 | #35 | Exceptional $115,957 |
| Immigrants | Switzerland | 100.0 /100 | #36 | Exceptional $115,934 |
| Maltese | 99.9 /100 | #37 | Exceptional $114,754 |
| Immigrants | Pakistan | 99.9 /100 | #38 | Exceptional $114,434 |
Demographics Similar to Okinawans by Householder Income Ages 45 - 64 years
In terms of householder income ages 45 - 64 years, the demographic groups most similar to Okinawans are Immigrants from South Central Asia ($124,188, a difference of 0.49%), Cypriot ($123,396, a difference of 1.1%), Immigrants from Israel ($122,893, a difference of 1.5%), Immigrants from Ireland ($122,757, a difference of 1.7%), and Immigrants from Iran ($126,940, a difference of 1.7%).
| Demographics | Rating | Rank | Householder Income Ages 45 - 64 years |
| Filipinos | 100.0 /100 | #2 | Exceptional $134,910 |
| Immigrants | India | 100.0 /100 | #3 | Exceptional $132,488 |
| Thais | 100.0 /100 | #4 | Exceptional $129,560 |
| Immigrants | Singapore | 100.0 /100 | #5 | Exceptional $129,514 |
| Iranians | 100.0 /100 | #6 | Exceptional $129,350 |
| Immigrants | Hong Kong | 100.0 /100 | #7 | Exceptional $127,500 |
| Immigrants | Iran | 100.0 /100 | #8 | Exceptional $126,940 |
| Okinawans | 100.0 /100 | #9 | Exceptional $124,796 |
| Immigrants | South Central Asia | 100.0 /100 | #10 | Exceptional $124,188 |
| Cypriots | 100.0 /100 | #11 | Exceptional $123,396 |
| Immigrants | Israel | 100.0 /100 | #12 | Exceptional $122,893 |
| Immigrants | Ireland | 100.0 /100 | #13 | Exceptional $122,757 |
| Indians (Asian) | 100.0 /100 | #14 | Exceptional $122,343 |
| Immigrants | Eastern Asia | 100.0 /100 | #15 | Exceptional $122,222 |
| Immigrants | China | 100.0 /100 | #16 | Exceptional $122,178 |