Bulgarian vs Immigrants from Romania Single Mother Households
COMPARE
Bulgarian
Immigrants from Romania
Single Mother Households
Single Mother Households Comparison
Bulgarians
Immigrants from Romania
5.3%
SINGLE MOTHER HOUSEHOLDS
99.7/ 100
METRIC RATING
34th/ 347
METRIC RANK
5.5%
SINGLE MOTHER HOUSEHOLDS
99.0/ 100
METRIC RATING
56th/ 347
METRIC RANK
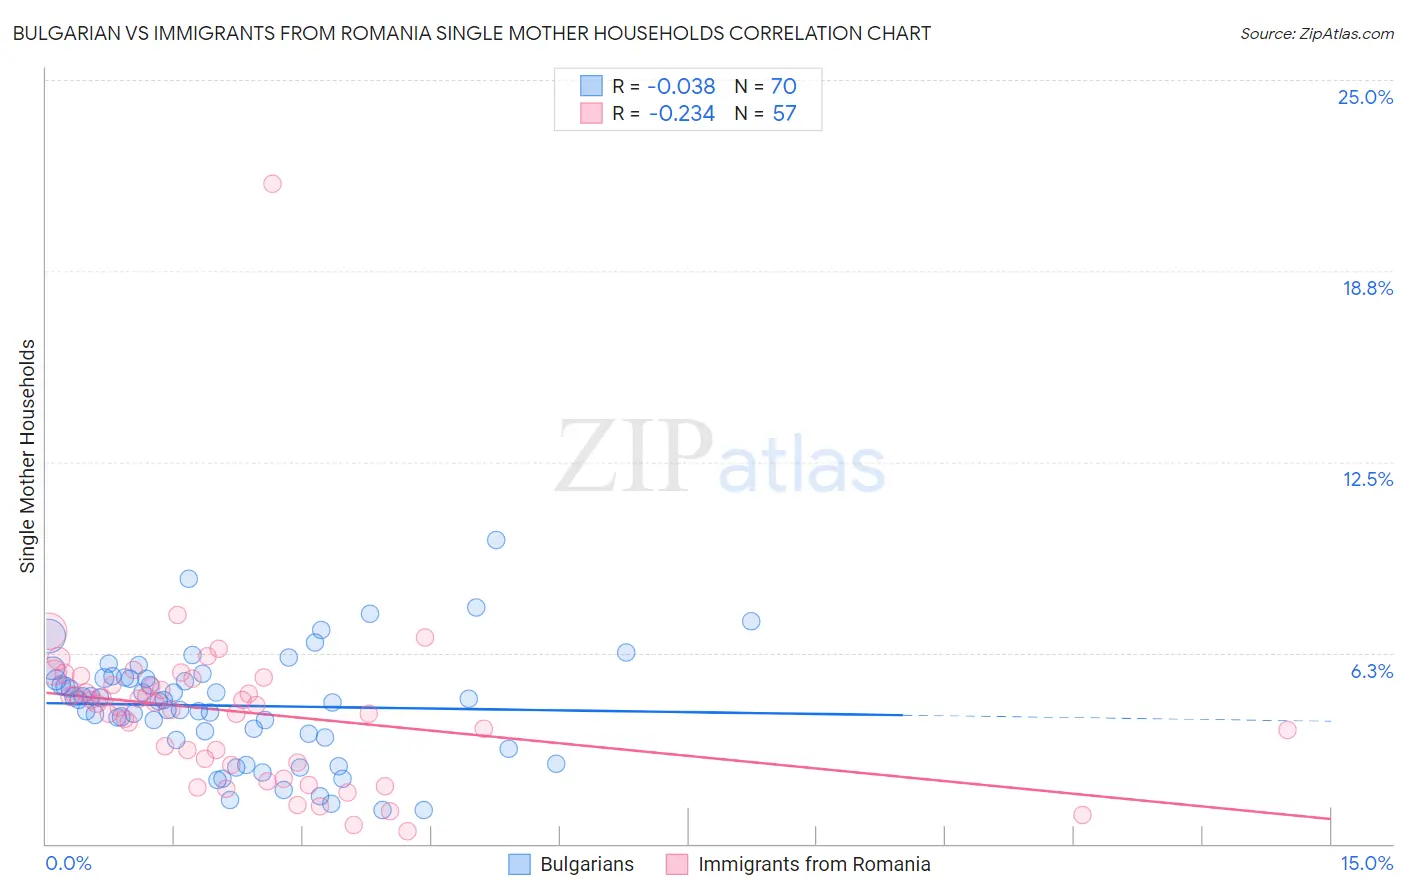
Bulgarian vs Immigrants from Romania Single Mother Households Correlation Chart
The statistical analysis conducted on geographies consisting of 205,286,227 people shows no correlation between the proportion of Bulgarians and percentage of single mother households in the United States with a correlation coefficient (R) of -0.038 and weighted average of 5.3%. Similarly, the statistical analysis conducted on geographies consisting of 256,535,689 people shows a weak negative correlation between the proportion of Immigrants from Romania and percentage of single mother households in the United States with a correlation coefficient (R) of -0.234 and weighted average of 5.5%, a difference of 3.8%.
Single Mother Households Correlation Summary
| Measurement | Bulgarian | Immigrants from Romania |
| Minimum | 1.1% | 0.41% |
| Maximum | 9.9% | 21.6% |
| Range | 8.8% | 21.2% |
| Mean | 4.5% | 4.3% |
| Median | 4.7% | 4.6% |
| Interquartile 25% (IQ1) | 3.5% | 2.6% |
| Interquartile 75% (IQ3) | 5.4% | 5.3% |
| Interquartile Range (IQR) | 1.9% | 2.7% |
| Standard Deviation (Sample) | 1.8% | 2.9% |
| Standard Deviation (Population) | 1.8% | 2.9% |
Similar Demographics by Single Mother Households
Demographics Similar to Bulgarians by Single Mother Households
In terms of single mother households, the demographic groups most similar to Bulgarians are Immigrants from Switzerland (5.3%, a difference of 0.020%), Immigrants from Northern Europe (5.3%, a difference of 0.040%), Immigrants from Czechoslovakia (5.3%, a difference of 0.24%), Immigrants from Belgium (5.3%, a difference of 0.38%), and Immigrants from Korea (5.3%, a difference of 0.41%).
| Demographics | Rating | Rank | Single Mother Households |
| Bhutanese | 99.7 /100 | #27 | Exceptional 5.3% |
| Russians | 99.7 /100 | #28 | Exceptional 5.3% |
| Latvians | 99.7 /100 | #29 | Exceptional 5.3% |
| Burmese | 99.7 /100 | #30 | Exceptional 5.3% |
| Immigrants | Korea | 99.7 /100 | #31 | Exceptional 5.3% |
| Cambodians | 99.7 /100 | #32 | Exceptional 5.3% |
| Immigrants | Switzerland | 99.7 /100 | #33 | Exceptional 5.3% |
| Bulgarians | 99.7 /100 | #34 | Exceptional 5.3% |
| Immigrants | Northern Europe | 99.7 /100 | #35 | Exceptional 5.3% |
| Immigrants | Czechoslovakia | 99.7 /100 | #36 | Exceptional 5.3% |
| Immigrants | Belgium | 99.7 /100 | #37 | Exceptional 5.3% |
| Immigrants | Serbia | 99.6 /100 | #38 | Exceptional 5.4% |
| Immigrants | Sweden | 99.6 /100 | #39 | Exceptional 5.4% |
| Estonians | 99.6 /100 | #40 | Exceptional 5.4% |
| Immigrants | Greece | 99.5 /100 | #41 | Exceptional 5.4% |
Demographics Similar to Immigrants from Romania by Single Mother Households
In terms of single mother households, the demographic groups most similar to Immigrants from Romania are Immigrants from Denmark (5.5%, a difference of 0.070%), Immigrants from Europe (5.5%, a difference of 0.080%), Immigrants from Lebanon (5.5%, a difference of 0.24%), Immigrants from Russia (5.5%, a difference of 0.26%), and Danish (5.5%, a difference of 0.32%).
| Demographics | Rating | Rank | Single Mother Households |
| Immigrants | Latvia | 99.2 /100 | #49 | Exceptional 5.5% |
| Immigrants | Scotland | 99.2 /100 | #50 | Exceptional 5.5% |
| Immigrants | Belarus | 99.2 /100 | #51 | Exceptional 5.5% |
| Swedes | 99.1 /100 | #52 | Exceptional 5.5% |
| Immigrants | Russia | 99.1 /100 | #53 | Exceptional 5.5% |
| Immigrants | Lebanon | 99.1 /100 | #54 | Exceptional 5.5% |
| Immigrants | Denmark | 99.1 /100 | #55 | Exceptional 5.5% |
| Immigrants | Romania | 99.0 /100 | #56 | Exceptional 5.5% |
| Immigrants | Europe | 99.0 /100 | #57 | Exceptional 5.5% |
| Danes | 98.9 /100 | #58 | Exceptional 5.5% |
| Luxembourgers | 98.7 /100 | #59 | Exceptional 5.6% |
| Immigrants | Norway | 98.7 /100 | #60 | Exceptional 5.6% |
| Australians | 98.7 /100 | #61 | Exceptional 5.6% |
| Poles | 98.6 /100 | #62 | Exceptional 5.6% |
| Immigrants | North Macedonia | 98.6 /100 | #63 | Exceptional 5.6% |