American vs Immigrants from Romania Median Female Earnings
COMPARE
American
Immigrants from Romania
Median Female Earnings
Median Female Earnings Comparison
Americans
Immigrants from Romania
$35,777
MEDIAN FEMALE EARNINGS
0.0/ 100
METRIC RATING
292nd/ 347
METRIC RANK
$42,718
MEDIAN FEMALE EARNINGS
99.8/ 100
METRIC RATING
71st/ 347
METRIC RANK
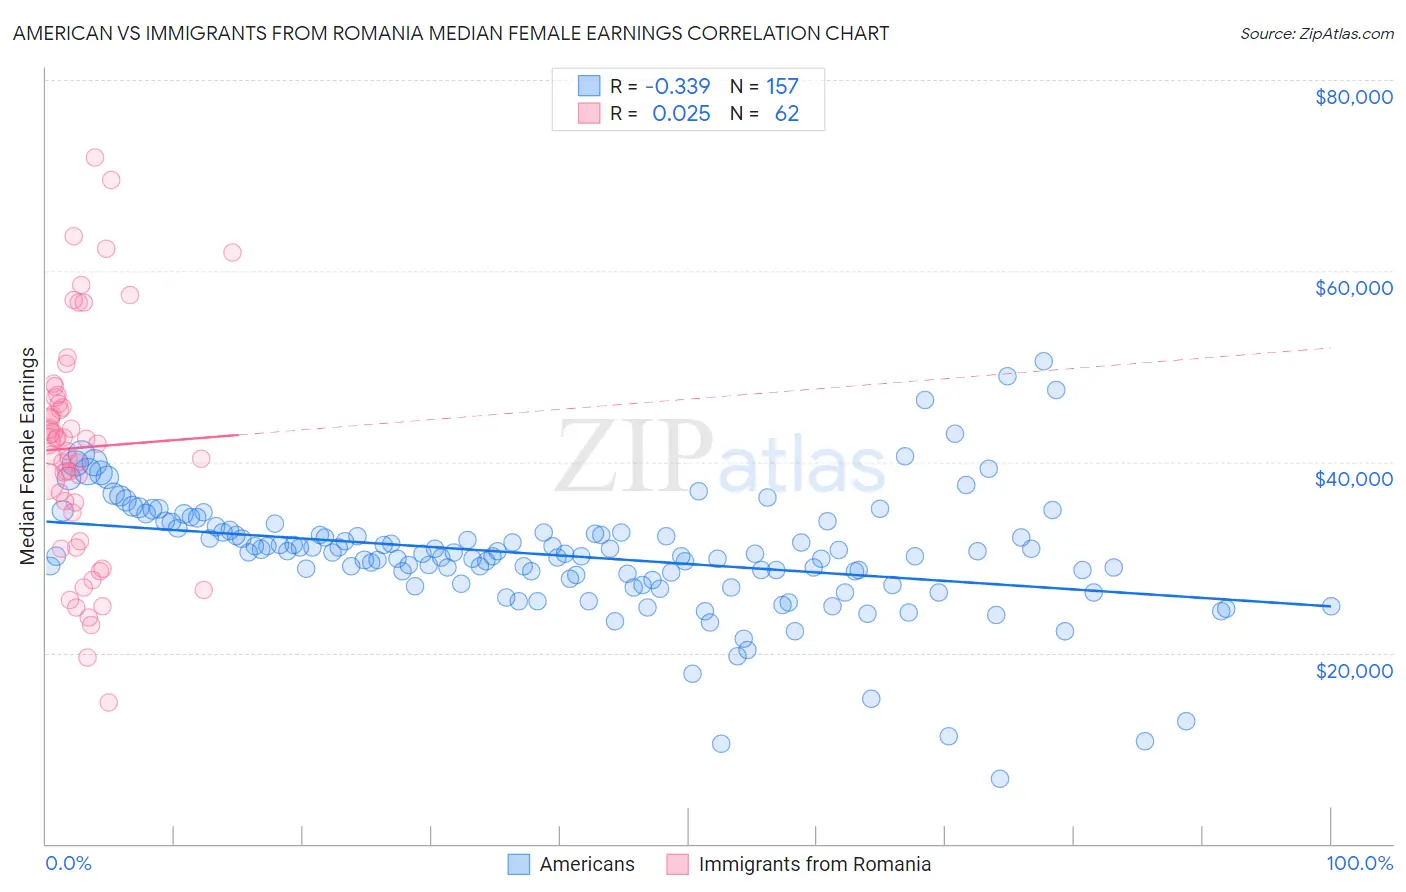
American vs Immigrants from Romania Median Female Earnings Correlation Chart
The statistical analysis conducted on geographies consisting of 579,438,585 people shows a mild negative correlation between the proportion of Americans and median female earnings in the United States with a correlation coefficient (R) of -0.339 and weighted average of $35,777. Similarly, the statistical analysis conducted on geographies consisting of 256,980,003 people shows no correlation between the proportion of Immigrants from Romania and median female earnings in the United States with a correlation coefficient (R) of 0.025 and weighted average of $42,718, a difference of 19.4%.
Median Female Earnings Correlation Summary
| Measurement | American | Immigrants from Romania |
| Minimum | $6,772 | $14,853 |
| Maximum | $50,517 | $71,891 |
| Range | $43,745 | $57,038 |
| Mean | $30,170 | $41,494 |
| Median | $30,366 | $42,030 |
| Interquartile 25% (IQ1) | $27,419 | $34,661 |
| Interquartile 75% (IQ3) | $32,737 | $46,785 |
| Interquartile Range (IQR) | $5,318 | $12,125 |
| Standard Deviation (Sample) | $6,408 | $12,041 |
| Standard Deviation (Population) | $6,387 | $11,943 |
Similar Demographics by Median Female Earnings
Demographics Similar to Americans by Median Female Earnings
In terms of median female earnings, the demographic groups most similar to Americans are Guatemalan ($35,695, a difference of 0.23%), Blackfeet ($35,864, a difference of 0.24%), Cheyenne ($35,673, a difference of 0.29%), Comanche ($35,661, a difference of 0.32%), and Mexican American Indian ($35,629, a difference of 0.42%).
| Demographics | Rating | Rank | Median Female Earnings |
| Paiute | 0.1 /100 | #285 | Tragic $36,056 |
| Osage | 0.0 /100 | #286 | Tragic $36,034 |
| Immigrants | Nicaragua | 0.0 /100 | #287 | Tragic $36,023 |
| Immigrants | Zaire | 0.0 /100 | #288 | Tragic $36,017 |
| Bangladeshis | 0.0 /100 | #289 | Tragic $35,960 |
| Central American Indians | 0.0 /100 | #290 | Tragic $35,930 |
| Blackfeet | 0.0 /100 | #291 | Tragic $35,864 |
| Americans | 0.0 /100 | #292 | Tragic $35,777 |
| Guatemalans | 0.0 /100 | #293 | Tragic $35,695 |
| Cheyenne | 0.0 /100 | #294 | Tragic $35,673 |
| Comanche | 0.0 /100 | #295 | Tragic $35,661 |
| Mexican American Indians | 0.0 /100 | #296 | Tragic $35,629 |
| Hmong | 0.0 /100 | #297 | Tragic $35,498 |
| Immigrants | Micronesia | 0.0 /100 | #298 | Tragic $35,477 |
| Immigrants | Guatemala | 0.0 /100 | #299 | Tragic $35,444 |
Demographics Similar to Immigrants from Romania by Median Female Earnings
In terms of median female earnings, the demographic groups most similar to Immigrants from Romania are Immigrants from Ethiopia ($42,744, a difference of 0.060%), Immigrants from Spain ($42,815, a difference of 0.23%), Immigrants from Austria ($42,824, a difference of 0.25%), Immigrants from Norway ($42,837, a difference of 0.28%), and Immigrants from Egypt ($42,837, a difference of 0.28%).
| Demographics | Rating | Rank | Median Female Earnings |
| Immigrants | Pakistan | 99.9 /100 | #64 | Exceptional $43,052 |
| Sierra Leoneans | 99.9 /100 | #65 | Exceptional $42,868 |
| Immigrants | Norway | 99.9 /100 | #66 | Exceptional $42,837 |
| Immigrants | Egypt | 99.9 /100 | #67 | Exceptional $42,837 |
| Immigrants | Austria | 99.8 /100 | #68 | Exceptional $42,824 |
| Immigrants | Spain | 99.8 /100 | #69 | Exceptional $42,815 |
| Immigrants | Ethiopia | 99.8 /100 | #70 | Exceptional $42,744 |
| Immigrants | Romania | 99.8 /100 | #71 | Exceptional $42,718 |
| Albanians | 99.8 /100 | #72 | Exceptional $42,584 |
| Mongolians | 99.7 /100 | #73 | Exceptional $42,542 |
| Immigrants | South Africa | 99.7 /100 | #74 | Exceptional $42,508 |
| New Zealanders | 99.7 /100 | #75 | Exceptional $42,446 |
| Immigrants | Italy | 99.7 /100 | #76 | Exceptional $42,446 |
| Immigrants | Albania | 99.6 /100 | #77 | Exceptional $42,388 |
| Immigrants | Kazakhstan | 99.6 /100 | #78 | Exceptional $42,386 |