Latvian vs Immigrants from Romania Median Female Earnings
COMPARE
Latvian
Immigrants from Romania
Median Female Earnings
Median Female Earnings Comparison
Latvians
Immigrants from Romania
$43,941
MEDIAN FEMALE EARNINGS
100.0/ 100
METRIC RATING
38th/ 347
METRIC RANK
$42,718
MEDIAN FEMALE EARNINGS
99.8/ 100
METRIC RATING
71st/ 347
METRIC RANK
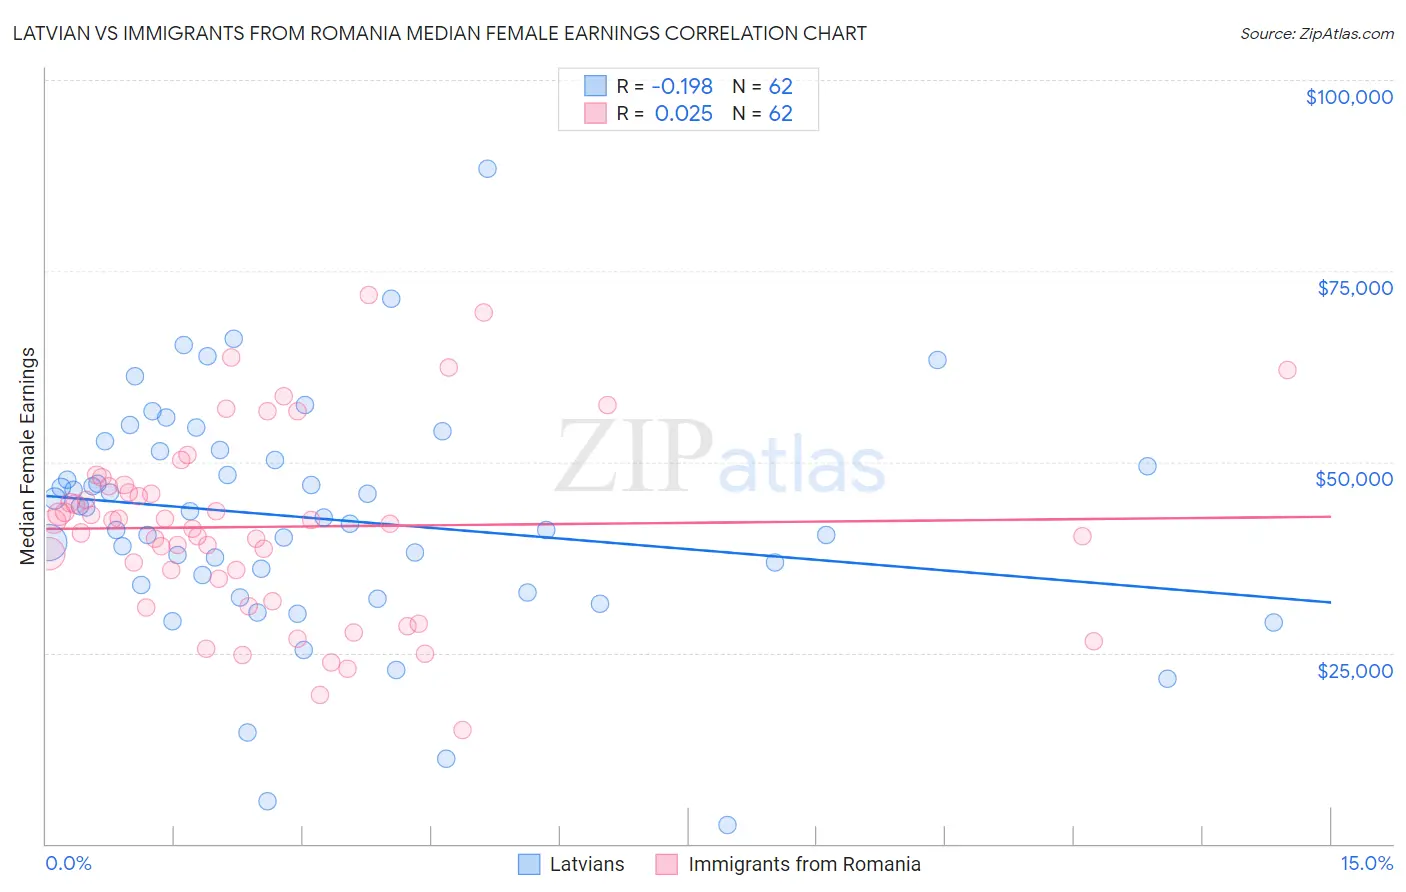
Latvian vs Immigrants from Romania Median Female Earnings Correlation Chart
The statistical analysis conducted on geographies consisting of 220,706,355 people shows a poor negative correlation between the proportion of Latvians and median female earnings in the United States with a correlation coefficient (R) of -0.198 and weighted average of $43,941. Similarly, the statistical analysis conducted on geographies consisting of 256,980,003 people shows no correlation between the proportion of Immigrants from Romania and median female earnings in the United States with a correlation coefficient (R) of 0.025 and weighted average of $42,718, a difference of 2.9%.
Median Female Earnings Correlation Summary
| Measurement | Latvian | Immigrants from Romania |
| Minimum | $2,499 | $14,853 |
| Maximum | $88,365 | $71,891 |
| Range | $85,866 | $57,038 |
| Mean | $42,555 | $41,494 |
| Median | $43,118 | $42,030 |
| Interquartile 25% (IQ1) | $33,868 | $34,661 |
| Interquartile 75% (IQ3) | $51,451 | $46,785 |
| Interquartile Range (IQR) | $17,583 | $12,125 |
| Standard Deviation (Sample) | $15,211 | $12,041 |
| Standard Deviation (Population) | $15,087 | $11,943 |
Similar Demographics by Median Female Earnings
Demographics Similar to Latvians by Median Female Earnings
In terms of median female earnings, the demographic groups most similar to Latvians are Immigrants from Switzerland ($43,996, a difference of 0.12%), Israeli ($43,852, a difference of 0.20%), Immigrants from Malaysia ($43,835, a difference of 0.24%), Immigrants from Turkey ($44,066, a difference of 0.28%), and Immigrants from Sri Lanka ($44,161, a difference of 0.50%).
| Demographics | Rating | Rank | Median Female Earnings |
| Immigrants | France | 100.0 /100 | #31 | Exceptional $44,541 |
| Immigrants | Northern Europe | 100.0 /100 | #32 | Exceptional $44,366 |
| Immigrants | Asia | 100.0 /100 | #33 | Exceptional $44,198 |
| Russians | 100.0 /100 | #34 | Exceptional $44,169 |
| Immigrants | Sri Lanka | 100.0 /100 | #35 | Exceptional $44,161 |
| Immigrants | Turkey | 100.0 /100 | #36 | Exceptional $44,066 |
| Immigrants | Switzerland | 100.0 /100 | #37 | Exceptional $43,996 |
| Latvians | 100.0 /100 | #38 | Exceptional $43,941 |
| Israelis | 100.0 /100 | #39 | Exceptional $43,852 |
| Immigrants | Malaysia | 100.0 /100 | #40 | Exceptional $43,835 |
| Bhutanese | 100.0 /100 | #41 | Exceptional $43,648 |
| Immigrants | Denmark | 100.0 /100 | #42 | Exceptional $43,646 |
| Bulgarians | 100.0 /100 | #43 | Exceptional $43,638 |
| Immigrants | Czechoslovakia | 100.0 /100 | #44 | Exceptional $43,571 |
| Immigrants | Europe | 100.0 /100 | #45 | Exceptional $43,523 |
Demographics Similar to Immigrants from Romania by Median Female Earnings
In terms of median female earnings, the demographic groups most similar to Immigrants from Romania are Immigrants from Ethiopia ($42,744, a difference of 0.060%), Immigrants from Spain ($42,815, a difference of 0.23%), Immigrants from Austria ($42,824, a difference of 0.25%), Immigrants from Norway ($42,837, a difference of 0.28%), and Immigrants from Egypt ($42,837, a difference of 0.28%).
| Demographics | Rating | Rank | Median Female Earnings |
| Immigrants | Pakistan | 99.9 /100 | #64 | Exceptional $43,052 |
| Sierra Leoneans | 99.9 /100 | #65 | Exceptional $42,868 |
| Immigrants | Norway | 99.9 /100 | #66 | Exceptional $42,837 |
| Immigrants | Egypt | 99.9 /100 | #67 | Exceptional $42,837 |
| Immigrants | Austria | 99.8 /100 | #68 | Exceptional $42,824 |
| Immigrants | Spain | 99.8 /100 | #69 | Exceptional $42,815 |
| Immigrants | Ethiopia | 99.8 /100 | #70 | Exceptional $42,744 |
| Immigrants | Romania | 99.8 /100 | #71 | Exceptional $42,718 |
| Albanians | 99.8 /100 | #72 | Exceptional $42,584 |
| Mongolians | 99.7 /100 | #73 | Exceptional $42,542 |
| Immigrants | South Africa | 99.7 /100 | #74 | Exceptional $42,508 |
| New Zealanders | 99.7 /100 | #75 | Exceptional $42,446 |
| Immigrants | Italy | 99.7 /100 | #76 | Exceptional $42,446 |
| Immigrants | Albania | 99.6 /100 | #77 | Exceptional $42,388 |
| Immigrants | Kazakhstan | 99.6 /100 | #78 | Exceptional $42,386 |