Bulgarian vs Immigrants from Dominican Republic High School Diploma
COMPARE
Bulgarian
Immigrants from Dominican Republic
High School Diploma
High School Diploma Comparison
Bulgarians
Immigrants from Dominican Republic
91.8%
HIGH SCHOOL DIPLOMA
100.0/ 100
METRIC RATING
14th/ 347
METRIC RANK
82.0%
HIGH SCHOOL DIPLOMA
0.0/ 100
METRIC RATING
336th/ 347
METRIC RANK
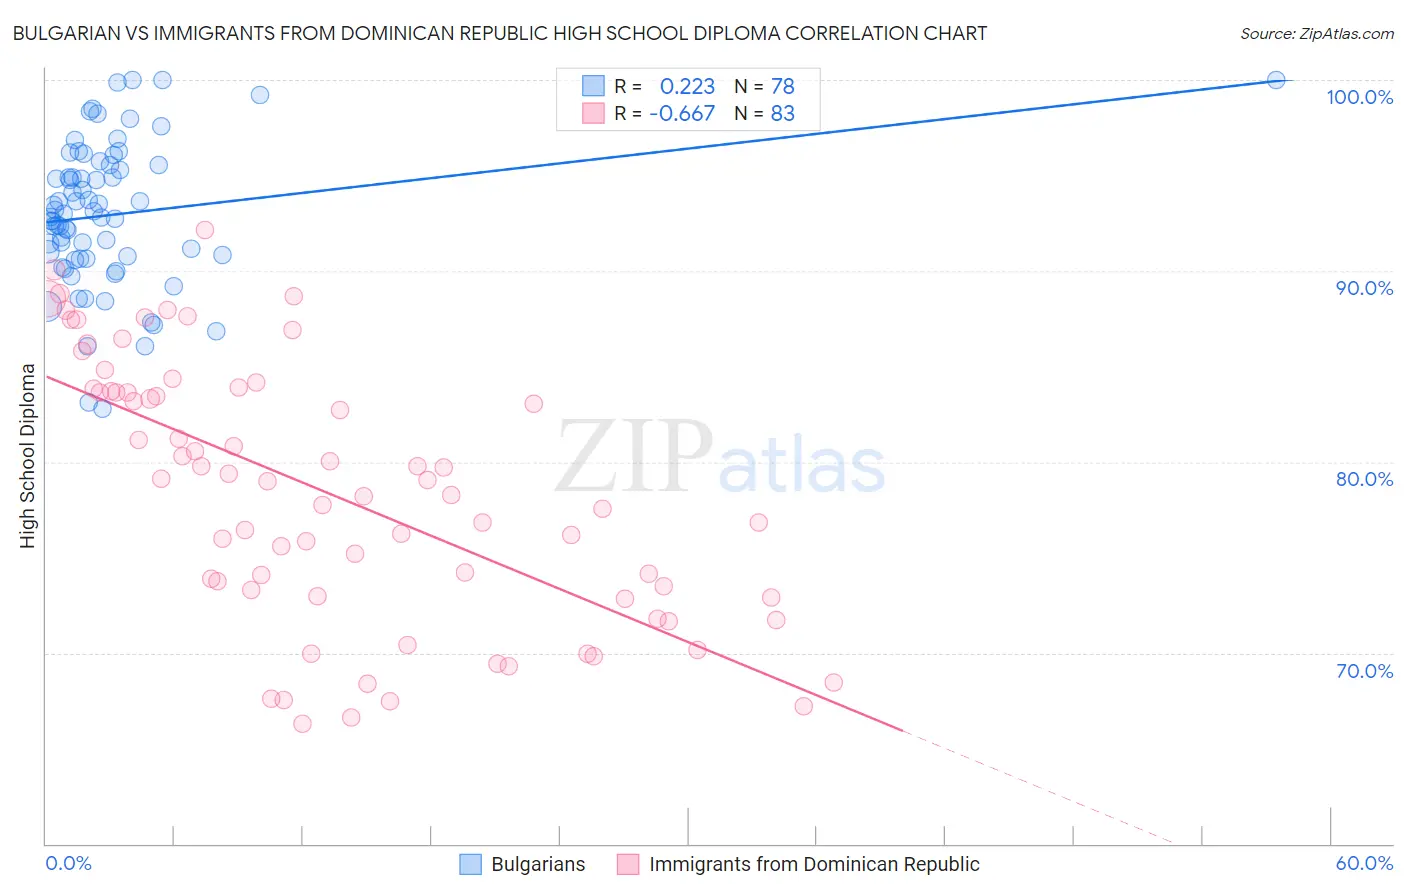
Bulgarian vs Immigrants from Dominican Republic High School Diploma Correlation Chart
The statistical analysis conducted on geographies consisting of 205,633,404 people shows a weak positive correlation between the proportion of Bulgarians and percentage of population with at least high school diploma education in the United States with a correlation coefficient (R) of 0.223 and weighted average of 91.8%. Similarly, the statistical analysis conducted on geographies consisting of 275,144,349 people shows a significant negative correlation between the proportion of Immigrants from Dominican Republic and percentage of population with at least high school diploma education in the United States with a correlation coefficient (R) of -0.667 and weighted average of 82.0%, a difference of 12.0%.
High School Diploma Correlation Summary
| Measurement | Bulgarian | Immigrants from Dominican Republic |
| Minimum | 82.8% | 66.3% |
| Maximum | 100.0% | 92.2% |
| Range | 17.2% | 25.9% |
| Mean | 93.0% | 78.4% |
| Median | 92.9% | 79.0% |
| Interquartile 25% (IQ1) | 90.7% | 73.0% |
| Interquartile 75% (IQ3) | 95.5% | 83.7% |
| Interquartile Range (IQR) | 4.9% | 10.8% |
| Standard Deviation (Sample) | 3.8% | 6.8% |
| Standard Deviation (Population) | 3.7% | 6.7% |
Similar Demographics by High School Diploma
Demographics Similar to Bulgarians by High School Diploma
In terms of high school diploma, the demographic groups most similar to Bulgarians are Luxembourger (91.7%, a difference of 0.030%), Danish (91.8%, a difference of 0.050%), Finnish (91.7%, a difference of 0.050%), Immigrants from Singapore (91.7%, a difference of 0.090%), and Polish (91.9%, a difference of 0.10%).
| Demographics | Rating | Rank | High School Diploma |
| Immigrants | India | 100.0 /100 | #7 | Exceptional 92.0% |
| Chinese | 100.0 /100 | #8 | Exceptional 92.0% |
| Latvians | 100.0 /100 | #9 | Exceptional 92.0% |
| Croatians | 100.0 /100 | #10 | Exceptional 92.0% |
| Eastern Europeans | 100.0 /100 | #11 | Exceptional 91.9% |
| Poles | 100.0 /100 | #12 | Exceptional 91.9% |
| Danes | 100.0 /100 | #13 | Exceptional 91.8% |
| Bulgarians | 100.0 /100 | #14 | Exceptional 91.8% |
| Luxembourgers | 100.0 /100 | #15 | Exceptional 91.7% |
| Finns | 100.0 /100 | #16 | Exceptional 91.7% |
| Immigrants | Singapore | 99.9 /100 | #17 | Exceptional 91.7% |
| Germans | 99.9 /100 | #18 | Exceptional 91.7% |
| Maltese | 99.9 /100 | #19 | Exceptional 91.6% |
| Czechs | 99.9 /100 | #20 | Exceptional 91.6% |
| Filipinos | 99.9 /100 | #21 | Exceptional 91.6% |
Demographics Similar to Immigrants from Dominican Republic by High School Diploma
In terms of high school diploma, the demographic groups most similar to Immigrants from Dominican Republic are Guatemalan (82.0%, a difference of 0.010%), Tohono O'odham (82.1%, a difference of 0.12%), Immigrants from Yemen (81.8%, a difference of 0.15%), Immigrants from Latin America (82.1%, a difference of 0.23%), and Salvadoran (81.7%, a difference of 0.32%).
| Demographics | Rating | Rank | High School Diploma |
| Hispanics or Latinos | 0.0 /100 | #329 | Tragic 82.9% |
| Immigrants | Azores | 0.0 /100 | #330 | Tragic 82.8% |
| Central Americans | 0.0 /100 | #331 | Tragic 82.5% |
| Immigrants | Honduras | 0.0 /100 | #332 | Tragic 82.5% |
| Immigrants | Latin America | 0.0 /100 | #333 | Tragic 82.1% |
| Tohono O'odham | 0.0 /100 | #334 | Tragic 82.1% |
| Guatemalans | 0.0 /100 | #335 | Tragic 82.0% |
| Immigrants | Dominican Republic | 0.0 /100 | #336 | Tragic 82.0% |
| Immigrants | Yemen | 0.0 /100 | #337 | Tragic 81.8% |
| Salvadorans | 0.0 /100 | #338 | Tragic 81.7% |
| Pima | 0.0 /100 | #339 | Tragic 81.6% |
| Houma | 0.0 /100 | #340 | Tragic 81.5% |
| Mexicans | 0.0 /100 | #341 | Tragic 81.4% |
| Immigrants | Guatemala | 0.0 /100 | #342 | Tragic 81.4% |
| Immigrants | El Salvador | 0.0 /100 | #343 | Tragic 80.8% |