Bulgarian vs Immigrants from Belize Median Earnings
COMPARE
Bulgarian
Immigrants from Belize
Median Earnings
Median Earnings Comparison
Bulgarians
Immigrants from Belize
$52,512
MEDIAN EARNINGS
100.0/ 100
METRIC RATING
44th/ 347
METRIC RANK
$42,339
MEDIAN EARNINGS
0.3/ 100
METRIC RATING
275th/ 347
METRIC RANK
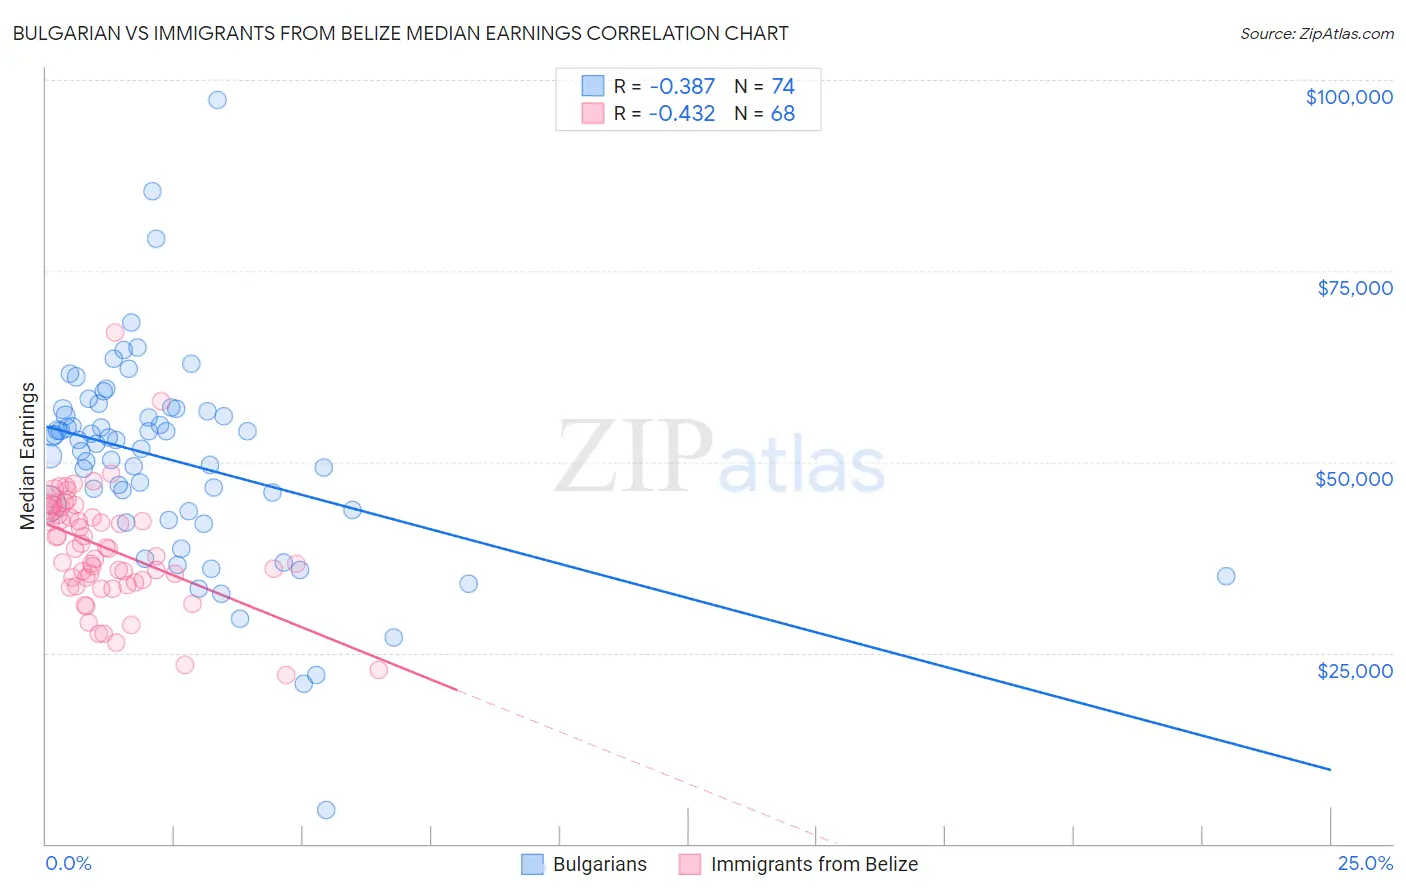
Bulgarian vs Immigrants from Belize Median Earnings Correlation Chart
The statistical analysis conducted on geographies consisting of 205,611,933 people shows a mild negative correlation between the proportion of Bulgarians and median earnings in the United States with a correlation coefficient (R) of -0.387 and weighted average of $52,512. Similarly, the statistical analysis conducted on geographies consisting of 130,311,555 people shows a moderate negative correlation between the proportion of Immigrants from Belize and median earnings in the United States with a correlation coefficient (R) of -0.432 and weighted average of $42,339, a difference of 24.0%.
Median Earnings Correlation Summary
| Measurement | Bulgarian | Immigrants from Belize |
| Minimum | $4,447 | $22,042 |
| Maximum | $97,313 | $66,975 |
| Range | $92,866 | $44,933 |
| Mean | $50,155 | $38,697 |
| Median | $52,637 | $38,598 |
| Interquartile 25% (IQ1) | $43,589 | $34,404 |
| Interquartile 75% (IQ3) | $56,548 | $43,711 |
| Interquartile Range (IQR) | $12,959 | $9,306 |
| Standard Deviation (Sample) | $13,758 | $7,646 |
| Standard Deviation (Population) | $13,665 | $7,590 |
Similar Demographics by Median Earnings
Demographics Similar to Bulgarians by Median Earnings
In terms of median earnings, the demographic groups most similar to Bulgarians are Immigrants from Malaysia ($52,514, a difference of 0.0%), Maltese ($52,526, a difference of 0.030%), Immigrants from Czechoslovakia ($52,361, a difference of 0.29%), Bhutanese ($52,297, a difference of 0.41%), and Australian ($52,294, a difference of 0.42%).
| Demographics | Rating | Rank | Median Earnings |
| Immigrants | Belarus | 100.0 /100 | #37 | Exceptional $53,043 |
| Latvians | 100.0 /100 | #38 | Exceptional $53,001 |
| Immigrants | Turkey | 100.0 /100 | #39 | Exceptional $52,960 |
| Israelis | 100.0 /100 | #40 | Exceptional $52,937 |
| Immigrants | Lithuania | 100.0 /100 | #41 | Exceptional $52,769 |
| Maltese | 100.0 /100 | #42 | Exceptional $52,526 |
| Immigrants | Malaysia | 100.0 /100 | #43 | Exceptional $52,514 |
| Bulgarians | 100.0 /100 | #44 | Exceptional $52,512 |
| Immigrants | Czechoslovakia | 100.0 /100 | #45 | Exceptional $52,361 |
| Bhutanese | 100.0 /100 | #46 | Exceptional $52,297 |
| Australians | 100.0 /100 | #47 | Exceptional $52,294 |
| Immigrants | Europe | 100.0 /100 | #48 | Exceptional $52,195 |
| Bolivians | 100.0 /100 | #49 | Exceptional $52,005 |
| Immigrants | South Africa | 100.0 /100 | #50 | Exceptional $51,850 |
| Immigrants | Austria | 99.9 /100 | #51 | Exceptional $51,826 |
Demographics Similar to Immigrants from Belize by Median Earnings
In terms of median earnings, the demographic groups most similar to Immigrants from Belize are Spanish American ($42,316, a difference of 0.060%), Central American ($42,280, a difference of 0.14%), Immigrants from El Salvador ($42,413, a difference of 0.18%), Immigrants from Dominica ($42,420, a difference of 0.19%), and Iroquois ($42,430, a difference of 0.22%).
| Demographics | Rating | Rank | Median Earnings |
| Americans | 0.6 /100 | #268 | Tragic $42,742 |
| Belizeans | 0.5 /100 | #269 | Tragic $42,702 |
| Osage | 0.5 /100 | #270 | Tragic $42,651 |
| Pennsylvania Germans | 0.5 /100 | #271 | Tragic $42,615 |
| Iroquois | 0.4 /100 | #272 | Tragic $42,430 |
| Immigrants | Dominica | 0.4 /100 | #273 | Tragic $42,420 |
| Immigrants | El Salvador | 0.4 /100 | #274 | Tragic $42,413 |
| Immigrants | Belize | 0.3 /100 | #275 | Tragic $42,339 |
| Spanish Americans | 0.3 /100 | #276 | Tragic $42,316 |
| Central Americans | 0.3 /100 | #277 | Tragic $42,280 |
| Cajuns | 0.3 /100 | #278 | Tragic $42,189 |
| Colville | 0.2 /100 | #279 | Tragic $42,151 |
| Hmong | 0.2 /100 | #280 | Tragic $42,111 |
| Marshallese | 0.2 /100 | #281 | Tragic $41,969 |
| Africans | 0.2 /100 | #282 | Tragic $41,955 |