Bulgarian vs Immigrants from Dominican Republic Median Family Income
COMPARE
Bulgarian
Immigrants from Dominican Republic
Median Family Income
Median Family Income Comparison
Bulgarians
Immigrants from Dominican Republic
$117,818
MEDIAN FAMILY INCOME
100.0/ 100
METRIC RATING
43rd/ 347
METRIC RANK
$81,233
MEDIAN FAMILY INCOME
0.0/ 100
METRIC RATING
331st/ 347
METRIC RANK
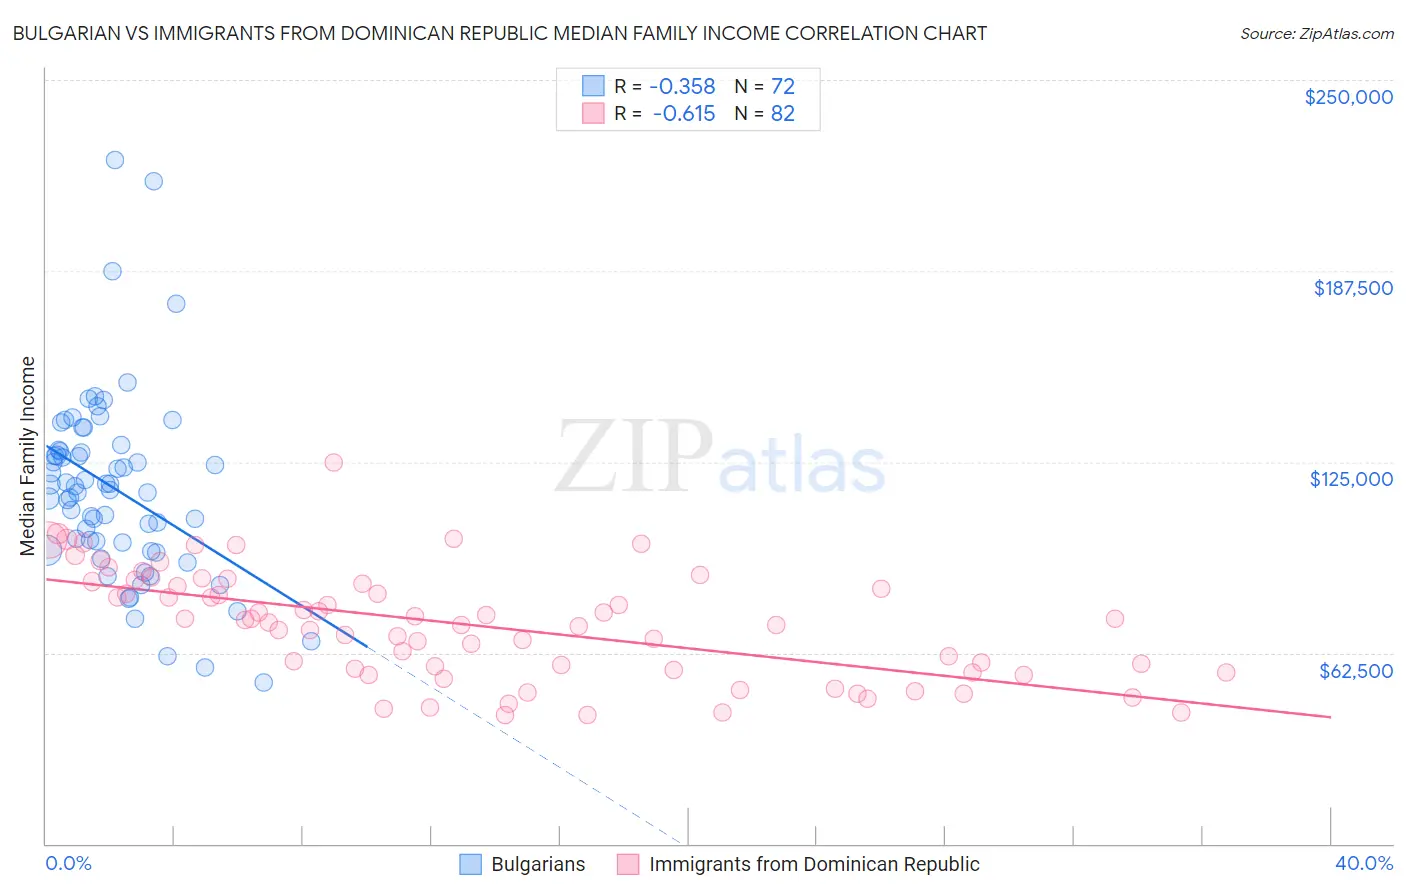
Bulgarian vs Immigrants from Dominican Republic Median Family Income Correlation Chart
The statistical analysis conducted on geographies consisting of 205,529,266 people shows a mild negative correlation between the proportion of Bulgarians and median family income in the United States with a correlation coefficient (R) of -0.358 and weighted average of $117,818. Similarly, the statistical analysis conducted on geographies consisting of 274,877,743 people shows a significant negative correlation between the proportion of Immigrants from Dominican Republic and median family income in the United States with a correlation coefficient (R) of -0.615 and weighted average of $81,233, a difference of 45.0%.
Median Family Income Correlation Summary
| Measurement | Bulgarian | Immigrants from Dominican Republic |
| Minimum | $52,778 | $41,996 |
| Maximum | $223,917 | $124,734 |
| Range | $171,139 | $82,738 |
| Mean | $116,110 | $71,698 |
| Median | $116,274 | $72,932 |
| Interquartile 25% (IQ1) | $97,368 | $56,743 |
| Interquartile 75% (IQ3) | $128,713 | $84,954 |
| Interquartile Range (IQR) | $31,345 | $28,211 |
| Standard Deviation (Sample) | $30,846 | $17,899 |
| Standard Deviation (Population) | $30,631 | $17,789 |
Similar Demographics by Median Family Income
Demographics Similar to Bulgarians by Median Family Income
In terms of median family income, the demographic groups most similar to Bulgarians are Cambodian ($117,780, a difference of 0.030%), Immigrants from Bolivia ($117,912, a difference of 0.080%), Estonian ($118,013, a difference of 0.17%), Immigrants from Lithuania ($118,053, a difference of 0.20%), and Immigrants from Asia ($118,291, a difference of 0.40%).
| Demographics | Rating | Rank | Median Family Income |
| Israelis | 100.0 /100 | #36 | Exceptional $118,577 |
| Australians | 100.0 /100 | #37 | Exceptional $118,440 |
| Immigrants | Turkey | 100.0 /100 | #38 | Exceptional $118,325 |
| Immigrants | Asia | 100.0 /100 | #39 | Exceptional $118,291 |
| Immigrants | Lithuania | 100.0 /100 | #40 | Exceptional $118,053 |
| Estonians | 100.0 /100 | #41 | Exceptional $118,013 |
| Immigrants | Bolivia | 100.0 /100 | #42 | Exceptional $117,912 |
| Bulgarians | 100.0 /100 | #43 | Exceptional $117,818 |
| Cambodians | 100.0 /100 | #44 | Exceptional $117,780 |
| Immigrants | Greece | 99.9 /100 | #45 | Exceptional $117,344 |
| Immigrants | Russia | 99.9 /100 | #46 | Exceptional $116,942 |
| Immigrants | Austria | 99.9 /100 | #47 | Exceptional $116,830 |
| Immigrants | South Africa | 99.9 /100 | #48 | Exceptional $116,286 |
| Chinese | 99.9 /100 | #49 | Exceptional $116,188 |
| Immigrants | Czechoslovakia | 99.9 /100 | #50 | Exceptional $116,165 |
Demographics Similar to Immigrants from Dominican Republic by Median Family Income
In terms of median family income, the demographic groups most similar to Immigrants from Dominican Republic are Cheyenne ($81,385, a difference of 0.19%), Native/Alaskan ($80,908, a difference of 0.40%), Kiowa ($80,885, a difference of 0.43%), Dutch West Indian ($81,852, a difference of 0.76%), and Black/African American ($81,912, a difference of 0.84%).
| Demographics | Rating | Rank | Median Family Income |
| Creek | 0.0 /100 | #324 | Tragic $82,560 |
| Sioux | 0.0 /100 | #325 | Tragic $82,386 |
| Immigrants | Congo | 0.0 /100 | #326 | Tragic $82,216 |
| Arapaho | 0.0 /100 | #327 | Tragic $82,064 |
| Blacks/African Americans | 0.0 /100 | #328 | Tragic $81,912 |
| Dutch West Indians | 0.0 /100 | #329 | Tragic $81,852 |
| Cheyenne | 0.0 /100 | #330 | Tragic $81,385 |
| Immigrants | Dominican Republic | 0.0 /100 | #331 | Tragic $81,233 |
| Natives/Alaskans | 0.0 /100 | #332 | Tragic $80,908 |
| Kiowa | 0.0 /100 | #333 | Tragic $80,885 |
| Menominee | 0.0 /100 | #334 | Tragic $79,563 |
| Yup'ik | 0.0 /100 | #335 | Tragic $79,290 |
| Immigrants | Cuba | 0.0 /100 | #336 | Tragic $78,249 |
| Yuman | 0.0 /100 | #337 | Tragic $78,055 |
| Immigrants | Yemen | 0.0 /100 | #338 | Tragic $77,457 |