Bulgarian vs Immigrants from the Azores Median Earnings
COMPARE
Bulgarian
Immigrants from the Azores
Median Earnings
Median Earnings Comparison
Bulgarians
Immigrants from the Azores
$52,512
MEDIAN EARNINGS
100.0/ 100
METRIC RATING
44th/ 347
METRIC RANK
$45,812
MEDIAN EARNINGS
29.5/ 100
METRIC RATING
200th/ 347
METRIC RANK
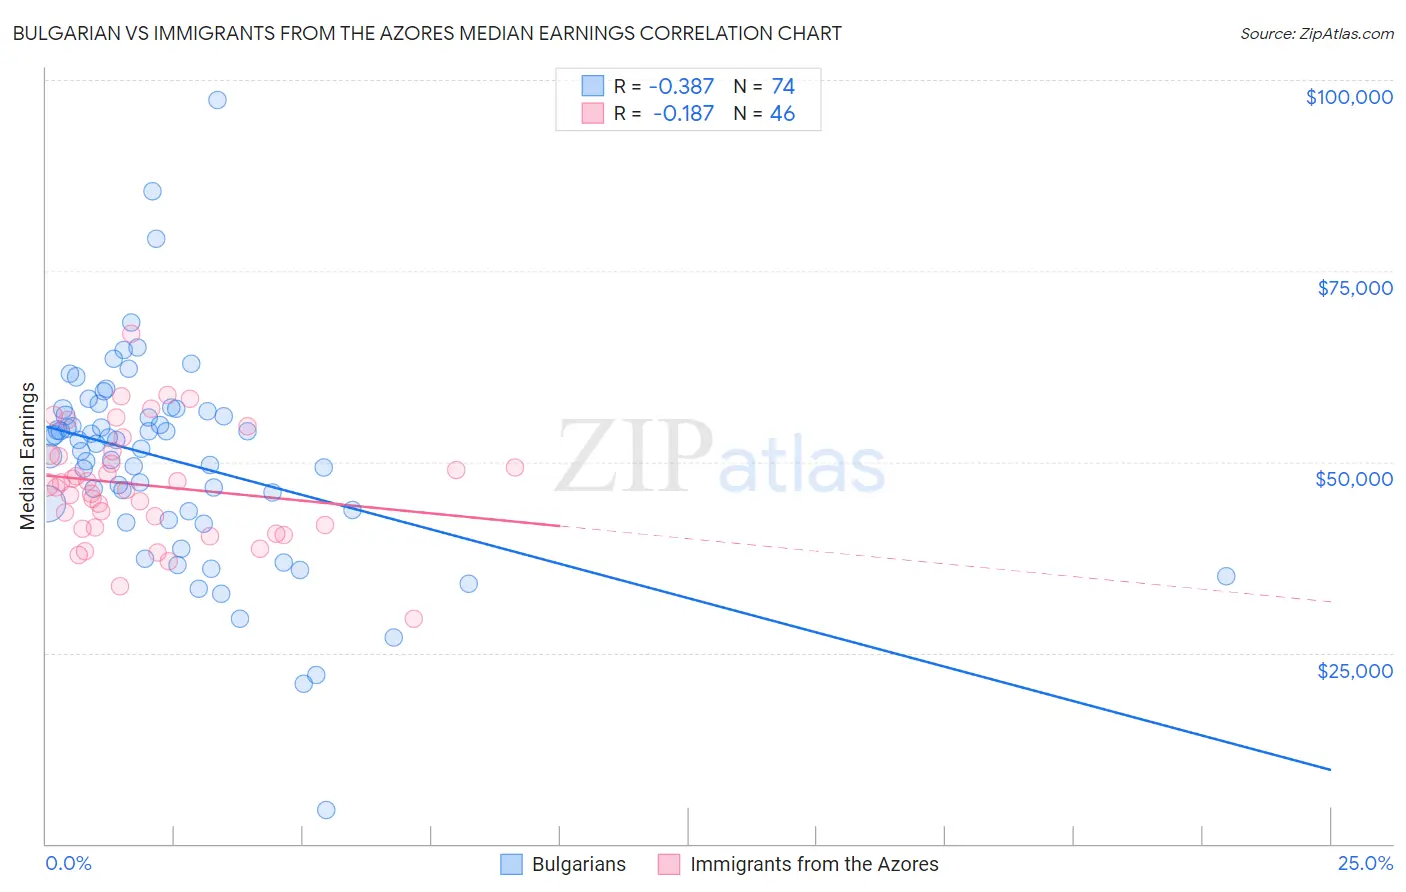
Bulgarian vs Immigrants from the Azores Median Earnings Correlation Chart
The statistical analysis conducted on geographies consisting of 205,611,933 people shows a mild negative correlation between the proportion of Bulgarians and median earnings in the United States with a correlation coefficient (R) of -0.387 and weighted average of $52,512. Similarly, the statistical analysis conducted on geographies consisting of 46,253,253 people shows a poor negative correlation between the proportion of Immigrants from the Azores and median earnings in the United States with a correlation coefficient (R) of -0.187 and weighted average of $45,812, a difference of 14.6%.
Median Earnings Correlation Summary
| Measurement | Bulgarian | Immigrants from the Azores |
| Minimum | $4,447 | $29,500 |
| Maximum | $97,313 | $66,731 |
| Range | $92,866 | $37,231 |
| Mean | $50,155 | $46,892 |
| Median | $52,637 | $46,853 |
| Interquartile 25% (IQ1) | $43,589 | $41,350 |
| Interquartile 75% (IQ3) | $56,548 | $50,852 |
| Interquartile Range (IQR) | $12,959 | $9,501 |
| Standard Deviation (Sample) | $13,758 | $7,383 |
| Standard Deviation (Population) | $13,665 | $7,302 |
Similar Demographics by Median Earnings
Demographics Similar to Bulgarians by Median Earnings
In terms of median earnings, the demographic groups most similar to Bulgarians are Immigrants from Malaysia ($52,514, a difference of 0.0%), Maltese ($52,526, a difference of 0.030%), Immigrants from Czechoslovakia ($52,361, a difference of 0.29%), Bhutanese ($52,297, a difference of 0.41%), and Australian ($52,294, a difference of 0.42%).
| Demographics | Rating | Rank | Median Earnings |
| Immigrants | Belarus | 100.0 /100 | #37 | Exceptional $53,043 |
| Latvians | 100.0 /100 | #38 | Exceptional $53,001 |
| Immigrants | Turkey | 100.0 /100 | #39 | Exceptional $52,960 |
| Israelis | 100.0 /100 | #40 | Exceptional $52,937 |
| Immigrants | Lithuania | 100.0 /100 | #41 | Exceptional $52,769 |
| Maltese | 100.0 /100 | #42 | Exceptional $52,526 |
| Immigrants | Malaysia | 100.0 /100 | #43 | Exceptional $52,514 |
| Bulgarians | 100.0 /100 | #44 | Exceptional $52,512 |
| Immigrants | Czechoslovakia | 100.0 /100 | #45 | Exceptional $52,361 |
| Bhutanese | 100.0 /100 | #46 | Exceptional $52,297 |
| Australians | 100.0 /100 | #47 | Exceptional $52,294 |
| Immigrants | Europe | 100.0 /100 | #48 | Exceptional $52,195 |
| Bolivians | 100.0 /100 | #49 | Exceptional $52,005 |
| Immigrants | South Africa | 100.0 /100 | #50 | Exceptional $51,850 |
| Immigrants | Austria | 99.9 /100 | #51 | Exceptional $51,826 |
Demographics Similar to Immigrants from the Azores by Median Earnings
In terms of median earnings, the demographic groups most similar to Immigrants from the Azores are Immigrants from Barbados ($45,816, a difference of 0.010%), Trinidadian and Tobagonian ($45,820, a difference of 0.020%), Yugoslavian ($45,846, a difference of 0.070%), Barbadian ($45,846, a difference of 0.070%), and Celtic ($45,732, a difference of 0.18%).
| Demographics | Rating | Rank | Median Earnings |
| Guamanians/Chamorros | 33.2 /100 | #193 | Fair $45,933 |
| Immigrants | Costa Rica | 33.0 /100 | #194 | Fair $45,928 |
| Immigrants | St. Vincent and the Grenadines | 32.4 /100 | #195 | Fair $45,908 |
| Yugoslavians | 30.5 /100 | #196 | Fair $45,846 |
| Barbadians | 30.5 /100 | #197 | Fair $45,846 |
| Trinidadians and Tobagonians | 29.7 /100 | #198 | Fair $45,820 |
| Immigrants | Barbados | 29.6 /100 | #199 | Fair $45,816 |
| Immigrants | Azores | 29.5 /100 | #200 | Fair $45,812 |
| Celtics | 27.2 /100 | #201 | Fair $45,732 |
| Immigrants | Trinidad and Tobago | 27.1 /100 | #202 | Fair $45,729 |
| Welsh | 26.6 /100 | #203 | Fair $45,710 |
| Immigrants | Uruguay | 25.9 /100 | #204 | Fair $45,682 |
| Tongans | 25.4 /100 | #205 | Fair $45,665 |
| Immigrants | Ghana | 24.8 /100 | #206 | Fair $45,641 |
| Immigrants | Senegal | 24.0 /100 | #207 | Fair $45,611 |