Immigrants from Uganda vs Carpatho Rusyn Median Female Earnings
COMPARE
Immigrants from Uganda
Carpatho Rusyn
Median Female Earnings
Median Female Earnings Comparison
Immigrants from Uganda
Carpatho Rusyns
$40,739
MEDIAN FEMALE EARNINGS
89.7/ 100
METRIC RATING
132nd/ 347
METRIC RANK
$40,825
MEDIAN FEMALE EARNINGS
91.2/ 100
METRIC RATING
128th/ 347
METRIC RANK
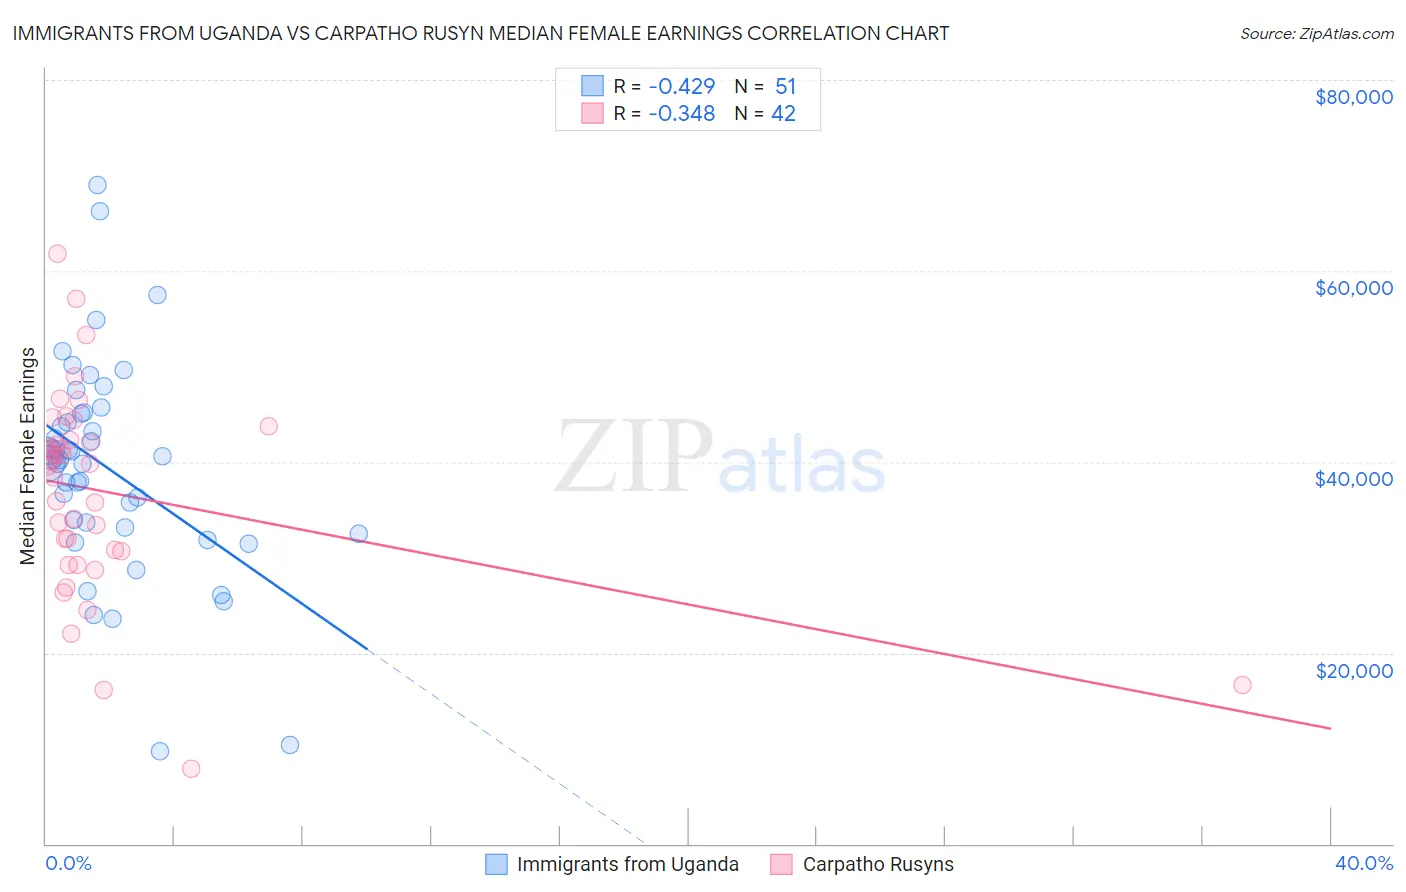
Immigrants from Uganda vs Carpatho Rusyn Median Female Earnings Correlation Chart
The statistical analysis conducted on geographies consisting of 125,969,564 people shows a moderate negative correlation between the proportion of Immigrants from Uganda and median female earnings in the United States with a correlation coefficient (R) of -0.429 and weighted average of $40,739. Similarly, the statistical analysis conducted on geographies consisting of 58,866,706 people shows a mild negative correlation between the proportion of Carpatho Rusyns and median female earnings in the United States with a correlation coefficient (R) of -0.348 and weighted average of $40,825, a difference of 0.21%.
Median Female Earnings Correlation Summary
| Measurement | Immigrants from Uganda | Carpatho Rusyn |
| Minimum | $9,732 | $7,813 |
| Maximum | $69,004 | $61,814 |
| Range | $59,272 | $54,001 |
| Mean | $39,368 | $36,836 |
| Median | $40,305 | $39,667 |
| Interquartile 25% (IQ1) | $33,173 | $30,625 |
| Interquartile 75% (IQ3) | $44,985 | $42,321 |
| Interquartile Range (IQR) | $11,812 | $11,696 |
| Standard Deviation (Sample) | $11,139 | $10,700 |
| Standard Deviation (Population) | $11,029 | $10,572 |
Demographics Similar to Immigrants from Uganda and Carpatho Rusyns by Median Female Earnings
In terms of median female earnings, the demographic groups most similar to Immigrants from Uganda are Syrian ($40,727, a difference of 0.030%), Chilean ($40,757, a difference of 0.040%), Arab ($40,718, a difference of 0.050%), Immigrants from Guyana ($40,773, a difference of 0.080%), and Immigrants from Nepal ($40,704, a difference of 0.090%). Similarly, the demographic groups most similar to Carpatho Rusyns are Zimbabwean ($40,798, a difference of 0.070%), Immigrants from Guyana ($40,773, a difference of 0.13%), Ugandan ($40,889, a difference of 0.16%), Immigrants from Trinidad and Tobago ($40,895, a difference of 0.17%), and Chilean ($40,757, a difference of 0.17%).
| Demographics | Rating | Rank | Median Female Earnings |
| Immigrants | Kuwait | 94.4 /100 | #120 | Exceptional $41,055 |
| Croatians | 93.7 /100 | #121 | Exceptional $40,993 |
| Immigrants | Jordan | 93.5 /100 | #122 | Exceptional $40,977 |
| Guyanese | 93.4 /100 | #123 | Exceptional $40,973 |
| Trinidadians and Tobagonians | 93.2 /100 | #124 | Exceptional $40,958 |
| Austrians | 92.7 /100 | #125 | Exceptional $40,923 |
| Immigrants | Trinidad and Tobago | 92.3 /100 | #126 | Exceptional $40,895 |
| Ugandans | 92.2 /100 | #127 | Exceptional $40,889 |
| Carpatho Rusyns | 91.2 /100 | #128 | Exceptional $40,825 |
| Zimbabweans | 90.8 /100 | #129 | Exceptional $40,798 |
| Immigrants | Guyana | 90.3 /100 | #130 | Exceptional $40,773 |
| Chileans | 90.0 /100 | #131 | Exceptional $40,757 |
| Immigrants | Uganda | 89.7 /100 | #132 | Excellent $40,739 |
| Syrians | 89.5 /100 | #133 | Excellent $40,727 |
| Arabs | 89.3 /100 | #134 | Excellent $40,718 |
| Immigrants | Nepal | 89.0 /100 | #135 | Excellent $40,704 |
| Immigrants | Eastern Africa | 87.7 /100 | #136 | Excellent $40,644 |
| Pakistanis | 86.6 /100 | #137 | Excellent $40,596 |
| Taiwanese | 86.1 /100 | #138 | Excellent $40,576 |
| Immigrants | South Eastern Asia | 85.7 /100 | #139 | Excellent $40,558 |
| Serbians | 85.2 /100 | #140 | Excellent $40,539 |