Puget Sound Salish vs Carpatho Rusyn Median Female Earnings
COMPARE
Puget Sound Salish
Carpatho Rusyn
Median Female Earnings
Median Female Earnings Comparison
Puget Sound Salish
Carpatho Rusyns
$39,376
MEDIAN FEMALE EARNINGS
33.9/ 100
METRIC RATING
190th/ 347
METRIC RANK
$40,825
MEDIAN FEMALE EARNINGS
91.2/ 100
METRIC RATING
128th/ 347
METRIC RANK
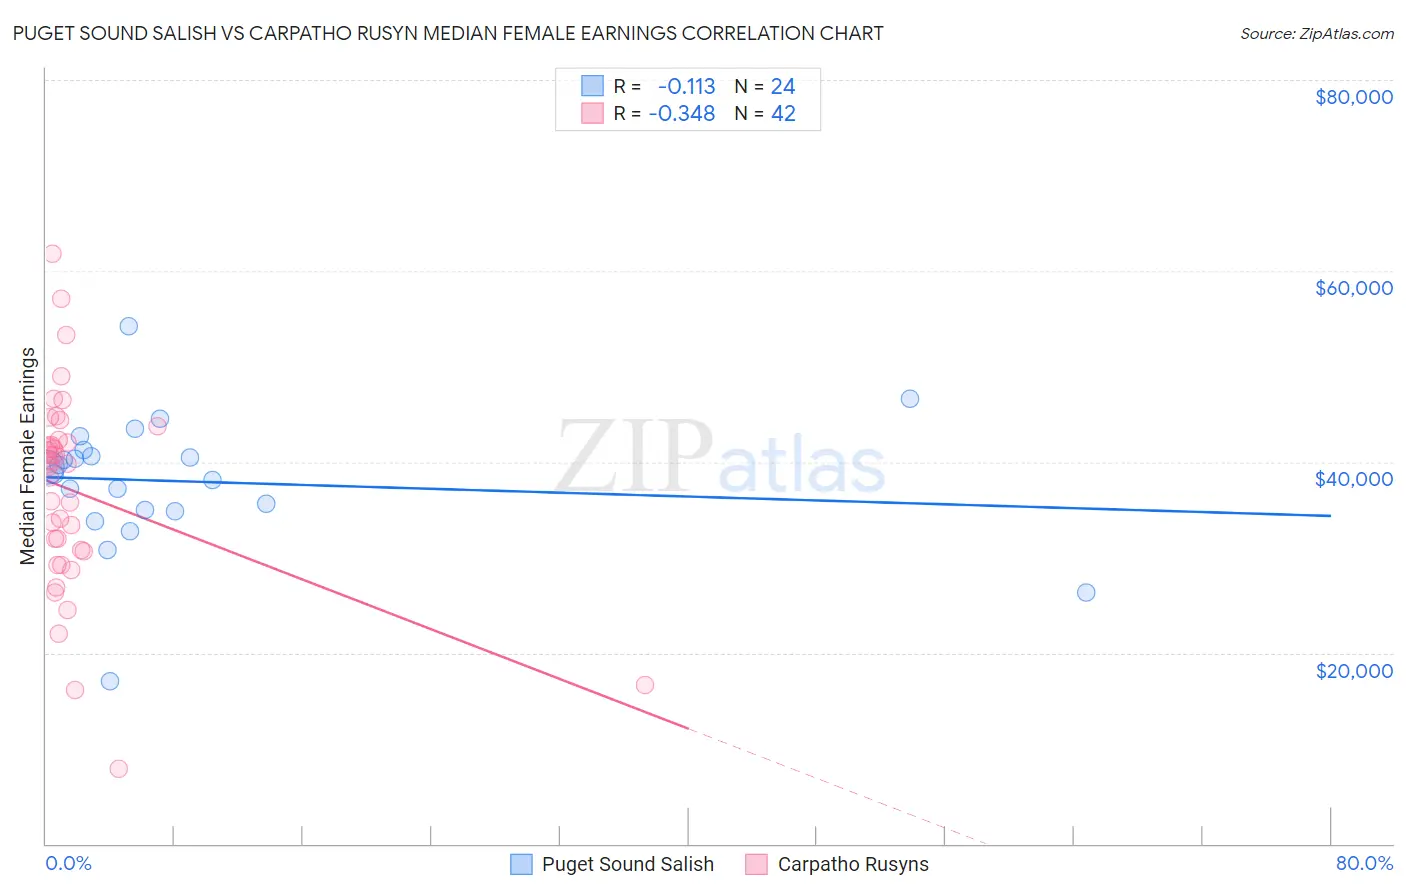
Puget Sound Salish vs Carpatho Rusyn Median Female Earnings Correlation Chart
The statistical analysis conducted on geographies consisting of 46,146,789 people shows a poor negative correlation between the proportion of Puget Sound Salish and median female earnings in the United States with a correlation coefficient (R) of -0.113 and weighted average of $39,376. Similarly, the statistical analysis conducted on geographies consisting of 58,866,706 people shows a mild negative correlation between the proportion of Carpatho Rusyns and median female earnings in the United States with a correlation coefficient (R) of -0.348 and weighted average of $40,825, a difference of 3.7%.
Median Female Earnings Correlation Summary
| Measurement | Puget Sound Salish | Carpatho Rusyn |
| Minimum | $17,028 | $7,813 |
| Maximum | $54,167 | $61,814 |
| Range | $37,139 | $54,001 |
| Mean | $37,933 | $36,836 |
| Median | $39,067 | $39,667 |
| Interquartile 25% (IQ1) | $34,884 | $30,625 |
| Interquartile 75% (IQ3) | $40,976 | $42,321 |
| Interquartile Range (IQR) | $6,092 | $11,696 |
| Standard Deviation (Sample) | $7,122 | $10,700 |
| Standard Deviation (Population) | $6,972 | $10,572 |
Similar Demographics by Median Female Earnings
Demographics Similar to Puget Sound Salish by Median Female Earnings
In terms of median female earnings, the demographic groups most similar to Puget Sound Salish are Senegalese ($39,384, a difference of 0.020%), Immigrants from Western Africa ($39,351, a difference of 0.060%), Swedish ($39,421, a difference of 0.11%), Bermudan ($39,418, a difference of 0.11%), and Immigrants ($39,328, a difference of 0.12%).
| Demographics | Rating | Rank | Median Female Earnings |
| Hungarians | 40.3 /100 | #183 | Average $39,510 |
| Europeans | 37.7 /100 | #184 | Fair $39,457 |
| Immigrants | West Indies | 36.9 /100 | #185 | Fair $39,441 |
| Colombians | 36.9 /100 | #186 | Fair $39,439 |
| Swedes | 36.0 /100 | #187 | Fair $39,421 |
| Bermudans | 35.9 /100 | #188 | Fair $39,418 |
| Senegalese | 34.2 /100 | #189 | Fair $39,384 |
| Puget Sound Salish | 33.9 /100 | #190 | Fair $39,376 |
| Immigrants | Western Africa | 32.7 /100 | #191 | Fair $39,351 |
| Immigrants | Immigrants | 31.7 /100 | #192 | Fair $39,328 |
| Immigrants | Nigeria | 30.2 /100 | #193 | Fair $39,294 |
| Irish | 30.0 /100 | #194 | Fair $39,291 |
| Uruguayans | 27.3 /100 | #195 | Fair $39,228 |
| Immigrants | Costa Rica | 25.6 /100 | #196 | Fair $39,186 |
| Assyrians/Chaldeans/Syriacs | 24.6 /100 | #197 | Fair $39,159 |
Demographics Similar to Carpatho Rusyns by Median Female Earnings
In terms of median female earnings, the demographic groups most similar to Carpatho Rusyns are Zimbabwean ($40,798, a difference of 0.070%), Immigrants from Guyana ($40,773, a difference of 0.13%), Ugandan ($40,889, a difference of 0.16%), Immigrants from Trinidad and Tobago ($40,895, a difference of 0.17%), and Chilean ($40,757, a difference of 0.17%).
| Demographics | Rating | Rank | Median Female Earnings |
| Croatians | 93.7 /100 | #121 | Exceptional $40,993 |
| Immigrants | Jordan | 93.5 /100 | #122 | Exceptional $40,977 |
| Guyanese | 93.4 /100 | #123 | Exceptional $40,973 |
| Trinidadians and Tobagonians | 93.2 /100 | #124 | Exceptional $40,958 |
| Austrians | 92.7 /100 | #125 | Exceptional $40,923 |
| Immigrants | Trinidad and Tobago | 92.3 /100 | #126 | Exceptional $40,895 |
| Ugandans | 92.2 /100 | #127 | Exceptional $40,889 |
| Carpatho Rusyns | 91.2 /100 | #128 | Exceptional $40,825 |
| Zimbabweans | 90.8 /100 | #129 | Exceptional $40,798 |
| Immigrants | Guyana | 90.3 /100 | #130 | Exceptional $40,773 |
| Chileans | 90.0 /100 | #131 | Exceptional $40,757 |
| Immigrants | Uganda | 89.7 /100 | #132 | Excellent $40,739 |
| Syrians | 89.5 /100 | #133 | Excellent $40,727 |
| Arabs | 89.3 /100 | #134 | Excellent $40,718 |
| Immigrants | Nepal | 89.0 /100 | #135 | Excellent $40,704 |