Immigrants from China vs Carpatho Rusyn Median Female Earnings
COMPARE
Immigrants from China
Carpatho Rusyn
Median Female Earnings
Median Female Earnings Comparison
Immigrants from China
Carpatho Rusyns
$46,972
MEDIAN FEMALE EARNINGS
100.0/ 100
METRIC RATING
10th/ 347
METRIC RANK
$40,825
MEDIAN FEMALE EARNINGS
91.2/ 100
METRIC RATING
128th/ 347
METRIC RANK
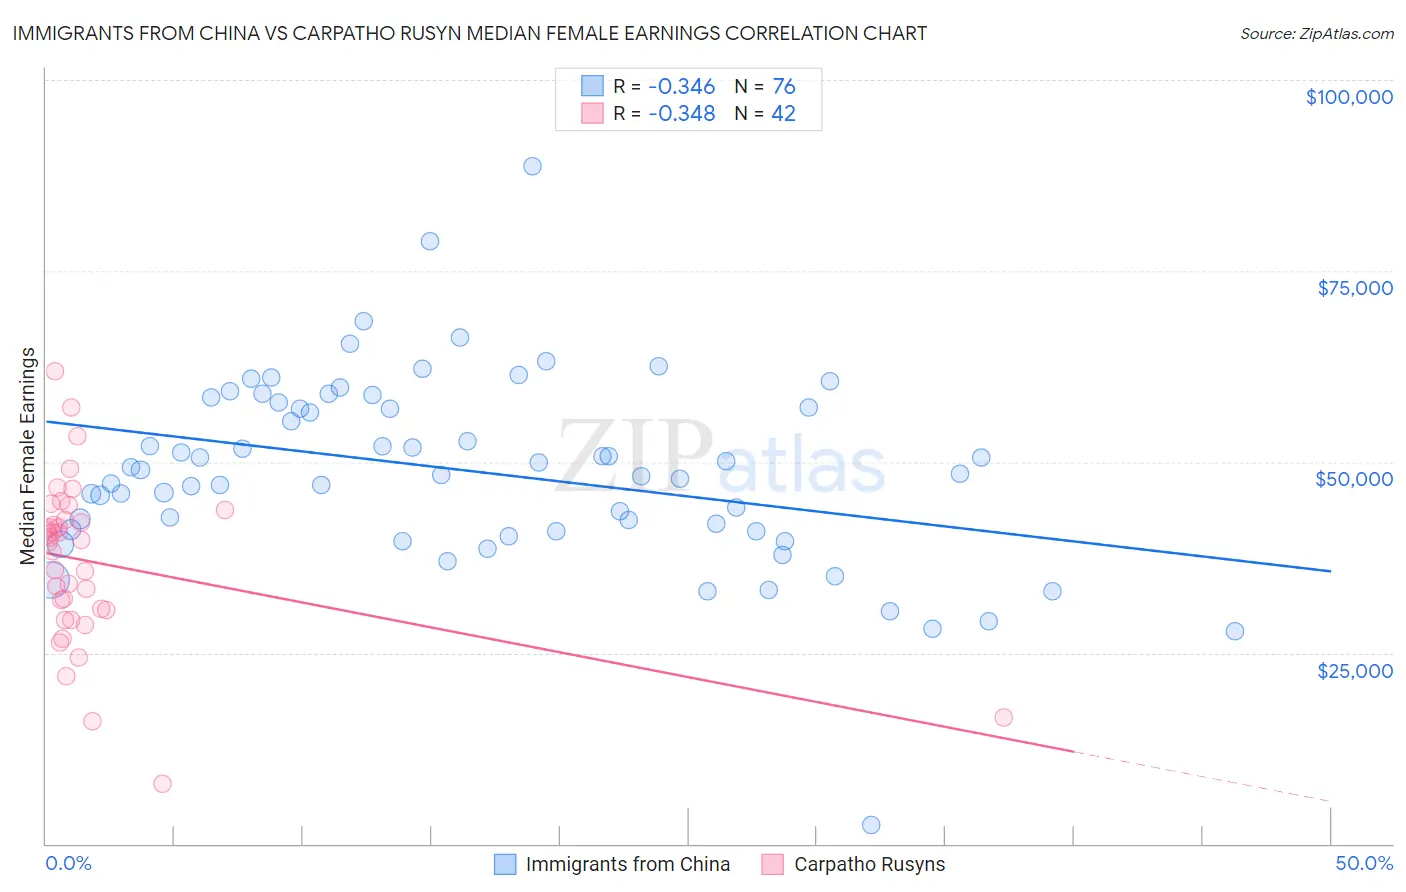
Immigrants from China vs Carpatho Rusyn Median Female Earnings Correlation Chart
The statistical analysis conducted on geographies consisting of 456,866,400 people shows a mild negative correlation between the proportion of Immigrants from China and median female earnings in the United States with a correlation coefficient (R) of -0.346 and weighted average of $46,972. Similarly, the statistical analysis conducted on geographies consisting of 58,866,706 people shows a mild negative correlation between the proportion of Carpatho Rusyns and median female earnings in the United States with a correlation coefficient (R) of -0.348 and weighted average of $40,825, a difference of 15.1%.
Median Female Earnings Correlation Summary
| Measurement | Immigrants from China | Carpatho Rusyn |
| Minimum | $2,499 | $7,813 |
| Maximum | $88,690 | $61,814 |
| Range | $86,191 | $54,001 |
| Mean | $48,809 | $36,836 |
| Median | $48,719 | $39,667 |
| Interquartile 25% (IQ1) | $41,024 | $30,625 |
| Interquartile 75% (IQ3) | $57,452 | $42,321 |
| Interquartile Range (IQR) | $16,427 | $11,696 |
| Standard Deviation (Sample) | $12,504 | $10,700 |
| Standard Deviation (Population) | $12,421 | $10,572 |
Similar Demographics by Median Female Earnings
Demographics Similar to Immigrants from China by Median Female Earnings
In terms of median female earnings, the demographic groups most similar to Immigrants from China are Okinawan ($46,905, a difference of 0.14%), Immigrants from Israel ($46,902, a difference of 0.15%), Immigrants from Iran ($47,154, a difference of 0.39%), Immigrants from Australia ($46,573, a difference of 0.86%), and Soviet Union ($46,556, a difference of 0.89%).
| Demographics | Rating | Rank | Median Female Earnings |
| Immigrants | Taiwan | 100.0 /100 | #3 | Exceptional $49,256 |
| Immigrants | India | 100.0 /100 | #4 | Exceptional $48,292 |
| Immigrants | Singapore | 100.0 /100 | #5 | Exceptional $47,986 |
| Immigrants | Ireland | 100.0 /100 | #6 | Exceptional $47,598 |
| Thais | 100.0 /100 | #7 | Exceptional $47,577 |
| Iranians | 100.0 /100 | #8 | Exceptional $47,421 |
| Immigrants | Iran | 100.0 /100 | #9 | Exceptional $47,154 |
| Immigrants | China | 100.0 /100 | #10 | Exceptional $46,972 |
| Okinawans | 100.0 /100 | #11 | Exceptional $46,905 |
| Immigrants | Israel | 100.0 /100 | #12 | Exceptional $46,902 |
| Immigrants | Australia | 100.0 /100 | #13 | Exceptional $46,573 |
| Soviet Union | 100.0 /100 | #14 | Exceptional $46,556 |
| Immigrants | Eastern Asia | 100.0 /100 | #15 | Exceptional $46,502 |
| Indians (Asian) | 100.0 /100 | #16 | Exceptional $46,481 |
| Immigrants | South Central Asia | 100.0 /100 | #17 | Exceptional $46,324 |
Demographics Similar to Carpatho Rusyns by Median Female Earnings
In terms of median female earnings, the demographic groups most similar to Carpatho Rusyns are Zimbabwean ($40,798, a difference of 0.070%), Immigrants from Guyana ($40,773, a difference of 0.13%), Ugandan ($40,889, a difference of 0.16%), Immigrants from Trinidad and Tobago ($40,895, a difference of 0.17%), and Chilean ($40,757, a difference of 0.17%).
| Demographics | Rating | Rank | Median Female Earnings |
| Croatians | 93.7 /100 | #121 | Exceptional $40,993 |
| Immigrants | Jordan | 93.5 /100 | #122 | Exceptional $40,977 |
| Guyanese | 93.4 /100 | #123 | Exceptional $40,973 |
| Trinidadians and Tobagonians | 93.2 /100 | #124 | Exceptional $40,958 |
| Austrians | 92.7 /100 | #125 | Exceptional $40,923 |
| Immigrants | Trinidad and Tobago | 92.3 /100 | #126 | Exceptional $40,895 |
| Ugandans | 92.2 /100 | #127 | Exceptional $40,889 |
| Carpatho Rusyns | 91.2 /100 | #128 | Exceptional $40,825 |
| Zimbabweans | 90.8 /100 | #129 | Exceptional $40,798 |
| Immigrants | Guyana | 90.3 /100 | #130 | Exceptional $40,773 |
| Chileans | 90.0 /100 | #131 | Exceptional $40,757 |
| Immigrants | Uganda | 89.7 /100 | #132 | Excellent $40,739 |
| Syrians | 89.5 /100 | #133 | Excellent $40,727 |
| Arabs | 89.3 /100 | #134 | Excellent $40,718 |
| Immigrants | Nepal | 89.0 /100 | #135 | Excellent $40,704 |