British West Indian vs Immigrants from Guatemala Median Earnings
COMPARE
British West Indian
Immigrants from Guatemala
Median Earnings
Median Earnings Comparison
British West Indians
Immigrants from Guatemala
$44,552
MEDIAN EARNINGS
6.7/ 100
METRIC RATING
236th/ 347
METRIC RANK
$40,851
MEDIAN EARNINGS
0.0/ 100
METRIC RATING
304th/ 347
METRIC RANK
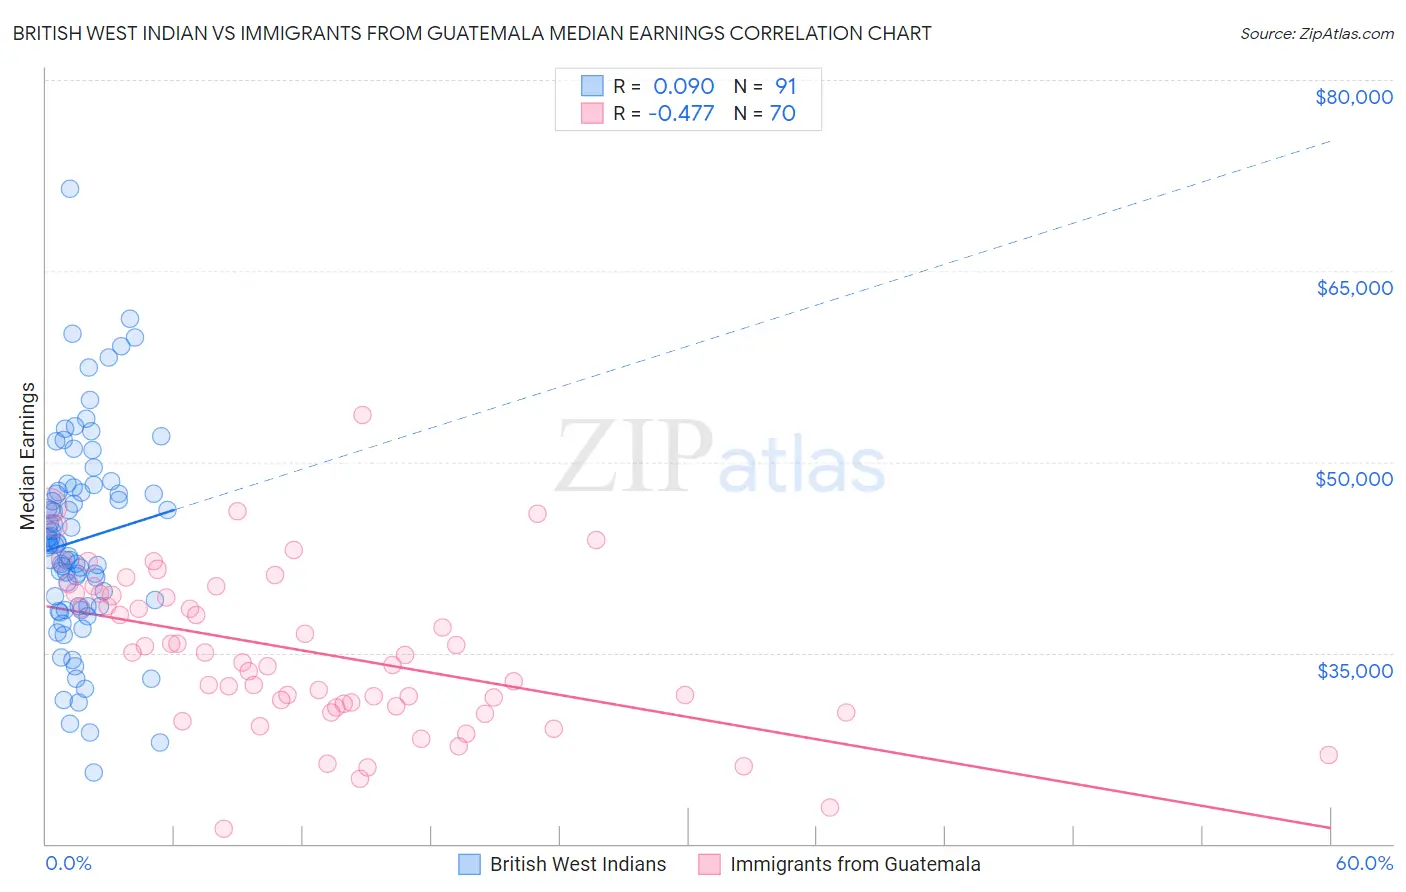
British West Indian vs Immigrants from Guatemala Median Earnings Correlation Chart
The statistical analysis conducted on geographies consisting of 152,701,918 people shows a slight positive correlation between the proportion of British West Indians and median earnings in the United States with a correlation coefficient (R) of 0.090 and weighted average of $44,552. Similarly, the statistical analysis conducted on geographies consisting of 377,268,152 people shows a moderate negative correlation between the proportion of Immigrants from Guatemala and median earnings in the United States with a correlation coefficient (R) of -0.477 and weighted average of $40,851, a difference of 9.1%.
Median Earnings Correlation Summary
| Measurement | British West Indian | Immigrants from Guatemala |
| Minimum | $25,617 | $21,140 |
| Maximum | $71,446 | $53,713 |
| Range | $45,829 | $32,573 |
| Mean | $43,859 | $35,043 |
| Median | $43,512 | $34,514 |
| Interquartile 25% (IQ1) | $38,648 | $30,761 |
| Interquartile 75% (IQ3) | $47,645 | $39,604 |
| Interquartile Range (IQR) | $8,997 | $8,843 |
| Standard Deviation (Sample) | $7,987 | $6,256 |
| Standard Deviation (Population) | $7,943 | $6,211 |
Similar Demographics by Median Earnings
Demographics Similar to British West Indians by Median Earnings
In terms of median earnings, the demographic groups most similar to British West Indians are Venezuelan ($44,580, a difference of 0.060%), Cape Verdean ($44,640, a difference of 0.20%), Immigrants from Ecuador ($44,462, a difference of 0.20%), Sudanese ($44,419, a difference of 0.30%), and Senegalese ($44,373, a difference of 0.40%).
| Demographics | Rating | Rank | Median Earnings |
| Scotch-Irish | 10.7 /100 | #229 | Poor $44,924 |
| Immigrants | Western Africa | 10.3 /100 | #230 | Poor $44,893 |
| Japanese | 9.5 /100 | #231 | Tragic $44,825 |
| Delaware | 9.0 /100 | #232 | Tragic $44,783 |
| Immigrants | Sudan | 8.8 /100 | #233 | Tragic $44,767 |
| Cape Verdeans | 7.5 /100 | #234 | Tragic $44,640 |
| Venezuelans | 6.9 /100 | #235 | Tragic $44,580 |
| British West Indians | 6.7 /100 | #236 | Tragic $44,552 |
| Immigrants | Ecuador | 5.9 /100 | #237 | Tragic $44,462 |
| Sudanese | 5.6 /100 | #238 | Tragic $44,419 |
| Senegalese | 5.3 /100 | #239 | Tragic $44,373 |
| Aleuts | 4.4 /100 | #240 | Tragic $44,241 |
| Samoans | 4.2 /100 | #241 | Tragic $44,206 |
| Immigrants | Venezuela | 4.0 /100 | #242 | Tragic $44,163 |
| Sub-Saharan Africans | 3.7 /100 | #243 | Tragic $44,118 |
Demographics Similar to Immigrants from Guatemala by Median Earnings
In terms of median earnings, the demographic groups most similar to Immigrants from Guatemala are Haitian ($40,918, a difference of 0.16%), Shoshone ($40,932, a difference of 0.20%), Chickasaw ($40,672, a difference of 0.44%), Immigrants from Latin America ($41,049, a difference of 0.48%), and Ute ($41,051, a difference of 0.49%).
| Demographics | Rating | Rank | Median Earnings |
| Guatemalans | 0.1 /100 | #297 | Tragic $41,205 |
| Immigrants | Micronesia | 0.1 /100 | #298 | Tragic $41,133 |
| Immigrants | Caribbean | 0.1 /100 | #299 | Tragic $41,119 |
| Ute | 0.1 /100 | #300 | Tragic $41,051 |
| Immigrants | Latin America | 0.1 /100 | #301 | Tragic $41,049 |
| Shoshone | 0.0 /100 | #302 | Tragic $40,932 |
| Haitians | 0.0 /100 | #303 | Tragic $40,918 |
| Immigrants | Guatemala | 0.0 /100 | #304 | Tragic $40,851 |
| Chickasaw | 0.0 /100 | #305 | Tragic $40,672 |
| Yaqui | 0.0 /100 | #306 | Tragic $40,647 |
| Hondurans | 0.0 /100 | #307 | Tragic $40,638 |
| Cubans | 0.0 /100 | #308 | Tragic $40,619 |
| Immigrants | Haiti | 0.0 /100 | #309 | Tragic $40,550 |
| Apache | 0.0 /100 | #310 | Tragic $40,388 |
| Hispanics or Latinos | 0.0 /100 | #311 | Tragic $40,288 |