British vs Ugandan Median Family Income
COMPARE
British
Ugandan
Median Family Income
Median Family Income Comparison
British
Ugandans
$108,705
MEDIAN FAMILY INCOME
95.6/ 100
METRIC RATING
110th/ 347
METRIC RANK
$106,541
MEDIAN FAMILY INCOME
87.8/ 100
METRIC RATING
133rd/ 347
METRIC RANK
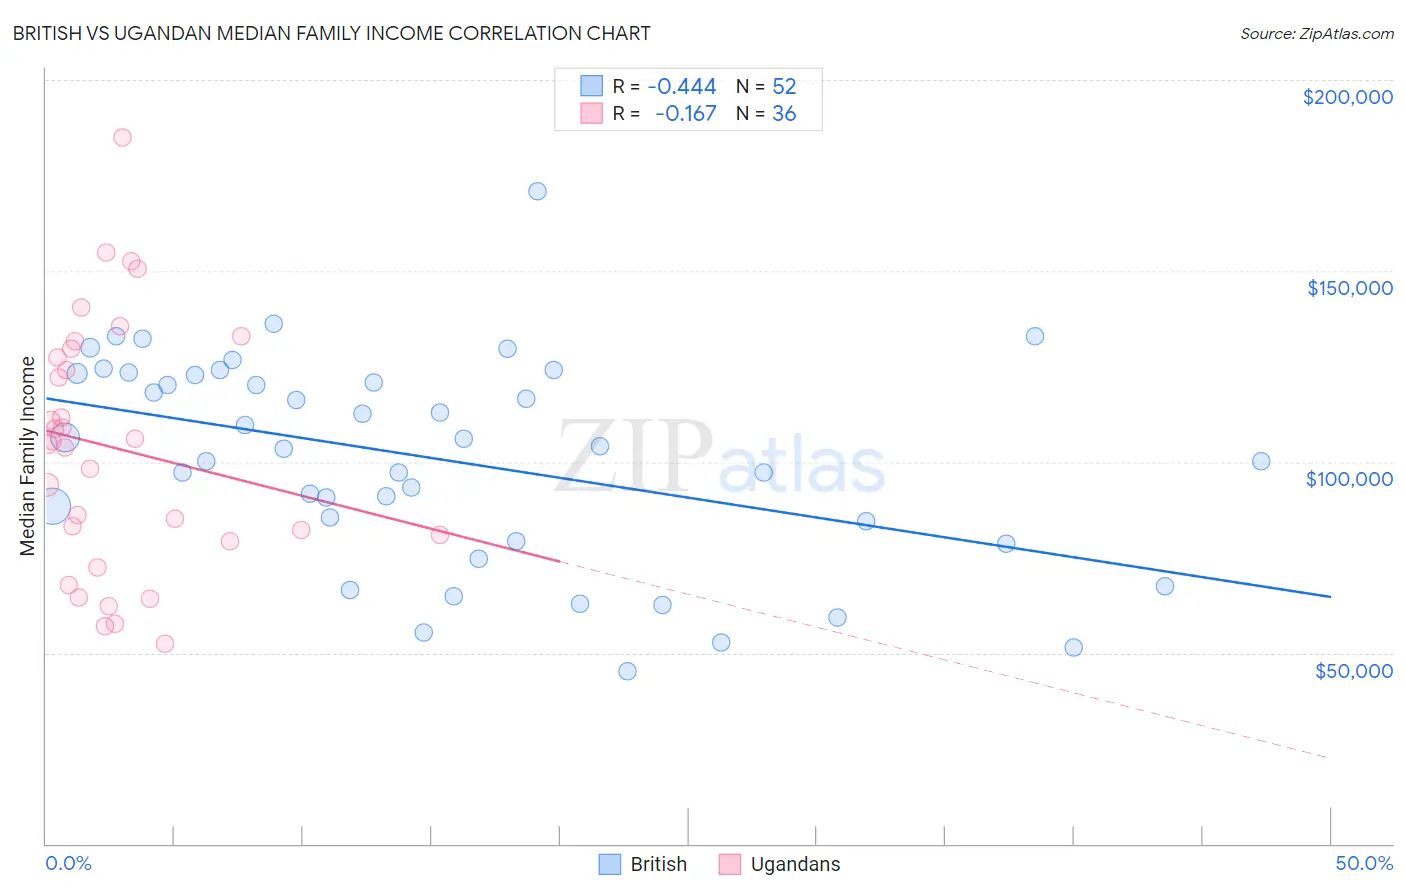
British vs Ugandan Median Family Income Correlation Chart
The statistical analysis conducted on geographies consisting of 530,672,110 people shows a moderate negative correlation between the proportion of British and median family income in the United States with a correlation coefficient (R) of -0.444 and weighted average of $108,705. Similarly, the statistical analysis conducted on geographies consisting of 93,987,569 people shows a poor negative correlation between the proportion of Ugandans and median family income in the United States with a correlation coefficient (R) of -0.167 and weighted average of $106,541, a difference of 2.0%.
Median Family Income Correlation Summary
| Measurement | British | Ugandan |
| Minimum | $45,060 | $52,432 |
| Maximum | $170,856 | $184,887 |
| Range | $125,796 | $132,455 |
| Mean | $100,714 | $103,672 |
| Median | $103,902 | $104,959 |
| Interquartile 25% (IQ1) | $81,768 | $79,923 |
| Interquartile 75% (IQ3) | $123,002 | $128,589 |
| Interquartile Range (IQR) | $41,234 | $48,666 |
| Standard Deviation (Sample) | $27,270 | $32,416 |
| Standard Deviation (Population) | $27,007 | $31,963 |
Similar Demographics by Median Family Income
Demographics Similar to British by Median Family Income
In terms of median family income, the demographic groups most similar to British are Immigrants from Afghanistan ($108,709, a difference of 0.0%), Immigrants from Western Asia ($108,691, a difference of 0.010%), Immigrants from Zimbabwe ($108,830, a difference of 0.12%), Immigrants from Poland ($108,570, a difference of 0.12%), and Immigrants from Saudi Arabia ($108,544, a difference of 0.15%).
| Demographics | Rating | Rank | Median Family Income |
| Immigrants | Brazil | 96.9 /100 | #103 | Exceptional $109,418 |
| Palestinians | 96.9 /100 | #104 | Exceptional $109,413 |
| Syrians | 96.7 /100 | #105 | Exceptional $109,299 |
| Albanians | 96.4 /100 | #106 | Exceptional $109,136 |
| Immigrants | North Macedonia | 96.4 /100 | #107 | Exceptional $109,136 |
| Immigrants | Zimbabwe | 95.9 /100 | #108 | Exceptional $108,830 |
| Immigrants | Afghanistan | 95.6 /100 | #109 | Exceptional $108,709 |
| British | 95.6 /100 | #110 | Exceptional $108,705 |
| Immigrants | Western Asia | 95.6 /100 | #111 | Exceptional $108,691 |
| Immigrants | Poland | 95.3 /100 | #112 | Exceptional $108,570 |
| Immigrants | Saudi Arabia | 95.2 /100 | #113 | Exceptional $108,544 |
| Poles | 95.2 /100 | #114 | Exceptional $108,507 |
| Swedes | 95.1 /100 | #115 | Exceptional $108,499 |
| Chileans | 95.0 /100 | #116 | Exceptional $108,429 |
| Immigrants | Philippines | 94.6 /100 | #117 | Exceptional $108,288 |
Demographics Similar to Ugandans by Median Family Income
In terms of median family income, the demographic groups most similar to Ugandans are Immigrants from Fiji ($106,544, a difference of 0.0%), Canadian ($106,597, a difference of 0.050%), Immigrants from Oceania ($106,453, a difference of 0.080%), Portuguese ($106,286, a difference of 0.24%), and Immigrants from South Eastern Asia ($106,252, a difference of 0.27%).
| Demographics | Rating | Rank | Median Family Income |
| Serbians | 90.8 /100 | #126 | Exceptional $107,157 |
| Lebanese | 90.5 /100 | #127 | Exceptional $107,086 |
| Immigrants | Ethiopia | 90.0 /100 | #128 | Excellent $106,969 |
| Arabs | 89.9 /100 | #129 | Excellent $106,952 |
| Brazilians | 89.8 /100 | #130 | Excellent $106,942 |
| Canadians | 88.1 /100 | #131 | Excellent $106,597 |
| Immigrants | Fiji | 87.8 /100 | #132 | Excellent $106,544 |
| Ugandans | 87.8 /100 | #133 | Excellent $106,541 |
| Immigrants | Oceania | 87.3 /100 | #134 | Excellent $106,453 |
| Portuguese | 86.3 /100 | #135 | Excellent $106,286 |
| Immigrants | South Eastern Asia | 86.1 /100 | #136 | Excellent $106,252 |
| Immigrants | Uganda | 85.7 /100 | #137 | Excellent $106,188 |
| Immigrants | Vietnam | 85.7 /100 | #138 | Excellent $106,186 |
| Luxembourgers | 85.7 /100 | #139 | Excellent $106,183 |
| Norwegians | 85.5 /100 | #140 | Excellent $106,144 |