Brazilian vs Immigrants from Trinidad and Tobago Median Female Earnings
COMPARE
Brazilian
Immigrants from Trinidad and Tobago
Median Female Earnings
Median Female Earnings Comparison
Brazilians
Immigrants from Trinidad and Tobago
$40,483
MEDIAN FEMALE EARNINGS
83.6/ 100
METRIC RATING
145th/ 347
METRIC RANK
$40,895
MEDIAN FEMALE EARNINGS
92.3/ 100
METRIC RATING
126th/ 347
METRIC RANK
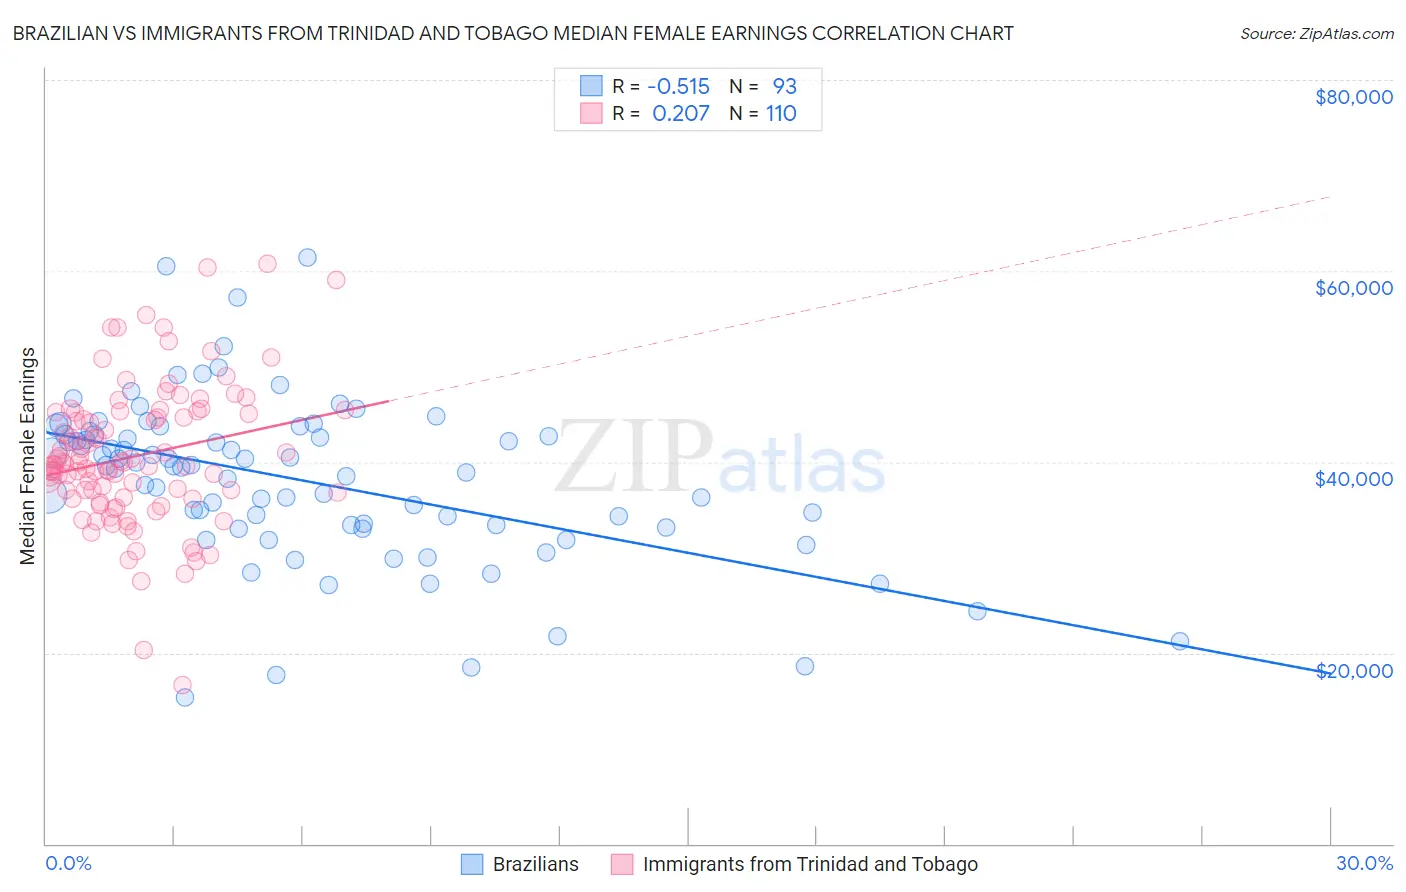
Brazilian vs Immigrants from Trinidad and Tobago Median Female Earnings Correlation Chart
The statistical analysis conducted on geographies consisting of 323,890,405 people shows a substantial negative correlation between the proportion of Brazilians and median female earnings in the United States with a correlation coefficient (R) of -0.515 and weighted average of $40,483. Similarly, the statistical analysis conducted on geographies consisting of 223,490,788 people shows a weak positive correlation between the proportion of Immigrants from Trinidad and Tobago and median female earnings in the United States with a correlation coefficient (R) of 0.207 and weighted average of $40,895, a difference of 1.0%.
Median Female Earnings Correlation Summary
| Measurement | Brazilian | Immigrants from Trinidad and Tobago |
| Minimum | $15,384 | $16,600 |
| Maximum | $61,398 | $60,818 |
| Range | $46,014 | $44,218 |
| Mean | $38,053 | $40,591 |
| Median | $39,528 | $39,706 |
| Interquartile 25% (IQ1) | $33,268 | $36,241 |
| Interquartile 75% (IQ3) | $42,843 | $45,207 |
| Interquartile Range (IQR) | $9,575 | $8,965 |
| Standard Deviation (Sample) | $8,528 | $7,375 |
| Standard Deviation (Population) | $8,482 | $7,342 |
Demographics Similar to Brazilians and Immigrants from Trinidad and Tobago by Median Female Earnings
In terms of median female earnings, the demographic groups most similar to Brazilians are Immigrants from North Macedonia ($40,488, a difference of 0.010%), Northern European ($40,491, a difference of 0.020%), Sri Lankan ($40,496, a difference of 0.030%), Immigrants from Syria ($40,499, a difference of 0.040%), and Serbian ($40,539, a difference of 0.14%). Similarly, the demographic groups most similar to Immigrants from Trinidad and Tobago are Ugandan ($40,889, a difference of 0.020%), Austrian ($40,923, a difference of 0.070%), Carpatho Rusyn ($40,825, a difference of 0.17%), Zimbabwean ($40,798, a difference of 0.24%), and Immigrants from Guyana ($40,773, a difference of 0.30%).
| Demographics | Rating | Rank | Median Female Earnings |
| Austrians | 92.7 /100 | #125 | Exceptional $40,923 |
| Immigrants | Trinidad and Tobago | 92.3 /100 | #126 | Exceptional $40,895 |
| Ugandans | 92.2 /100 | #127 | Exceptional $40,889 |
| Carpatho Rusyns | 91.2 /100 | #128 | Exceptional $40,825 |
| Zimbabweans | 90.8 /100 | #129 | Exceptional $40,798 |
| Immigrants | Guyana | 90.3 /100 | #130 | Exceptional $40,773 |
| Chileans | 90.0 /100 | #131 | Exceptional $40,757 |
| Immigrants | Uganda | 89.7 /100 | #132 | Excellent $40,739 |
| Syrians | 89.5 /100 | #133 | Excellent $40,727 |
| Arabs | 89.3 /100 | #134 | Excellent $40,718 |
| Immigrants | Nepal | 89.0 /100 | #135 | Excellent $40,704 |
| Immigrants | Eastern Africa | 87.7 /100 | #136 | Excellent $40,644 |
| Pakistanis | 86.6 /100 | #137 | Excellent $40,596 |
| Taiwanese | 86.1 /100 | #138 | Excellent $40,576 |
| Immigrants | South Eastern Asia | 85.7 /100 | #139 | Excellent $40,558 |
| Serbians | 85.2 /100 | #140 | Excellent $40,539 |
| Immigrants | Syria | 84.1 /100 | #141 | Excellent $40,499 |
| Sri Lankans | 84.0 /100 | #142 | Excellent $40,496 |
| Northern Europeans | 83.9 /100 | #143 | Excellent $40,491 |
| Immigrants | North Macedonia | 83.8 /100 | #144 | Excellent $40,488 |
| Brazilians | 83.6 /100 | #145 | Excellent $40,483 |