Immigrants from South Eastern Asia vs Immigrants from Trinidad and Tobago Median Female Earnings
COMPARE
Immigrants from South Eastern Asia
Immigrants from Trinidad and Tobago
Median Female Earnings
Median Female Earnings Comparison
Immigrants from South Eastern Asia
Immigrants from Trinidad and Tobago
$40,558
MEDIAN FEMALE EARNINGS
85.7/ 100
METRIC RATING
139th/ 347
METRIC RANK
$40,895
MEDIAN FEMALE EARNINGS
92.3/ 100
METRIC RATING
126th/ 347
METRIC RANK
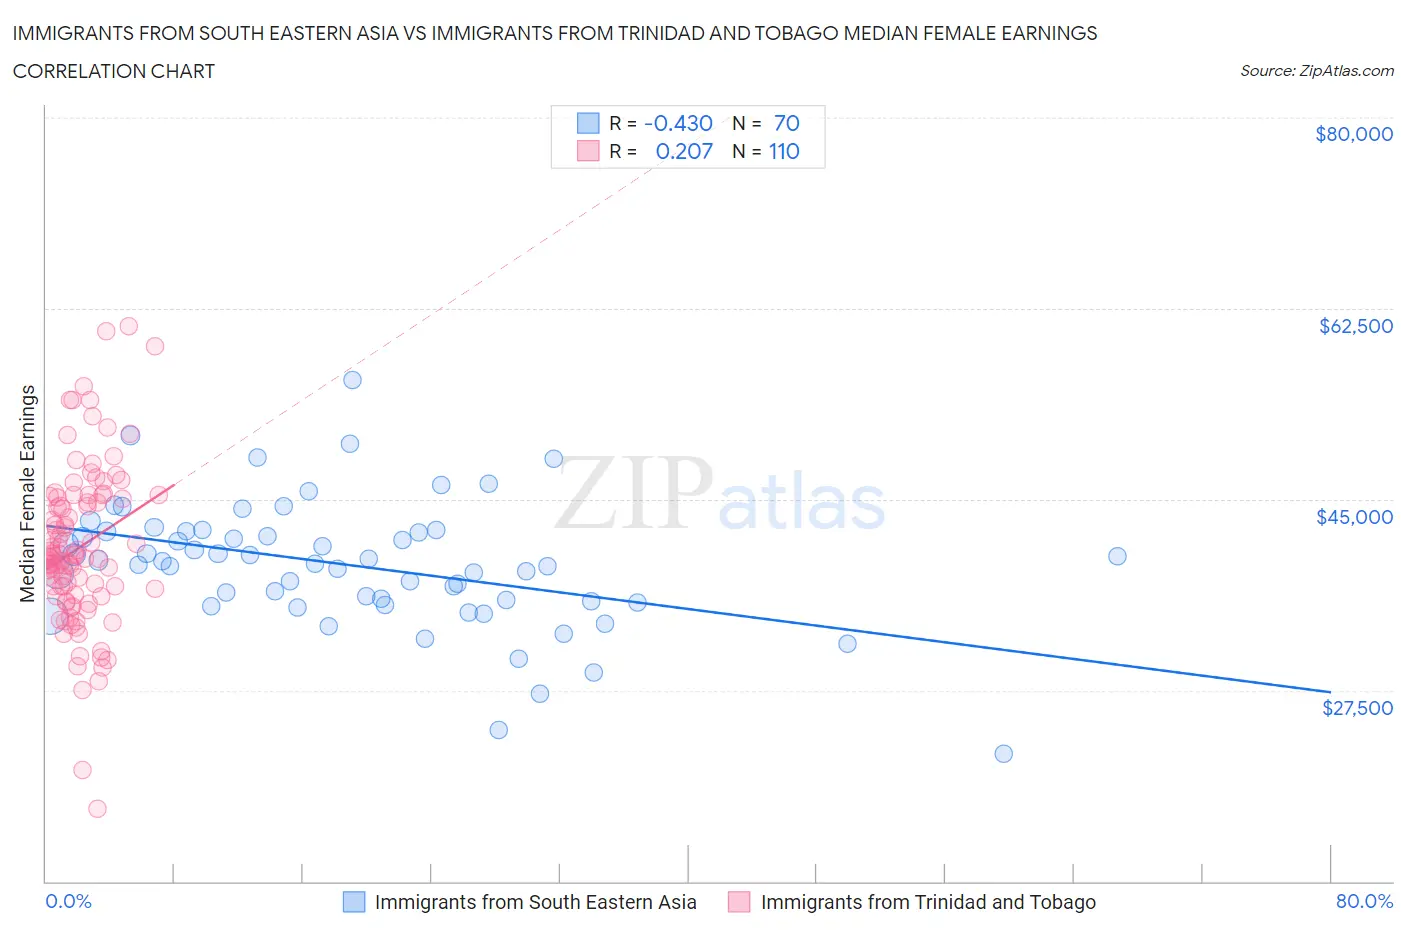
Immigrants from South Eastern Asia vs Immigrants from Trinidad and Tobago Median Female Earnings Correlation Chart
The statistical analysis conducted on geographies consisting of 512,224,211 people shows a moderate negative correlation between the proportion of Immigrants from South Eastern Asia and median female earnings in the United States with a correlation coefficient (R) of -0.430 and weighted average of $40,558. Similarly, the statistical analysis conducted on geographies consisting of 223,490,788 people shows a weak positive correlation between the proportion of Immigrants from Trinidad and Tobago and median female earnings in the United States with a correlation coefficient (R) of 0.207 and weighted average of $40,895, a difference of 0.83%.
Median Female Earnings Correlation Summary
| Measurement | Immigrants from South Eastern Asia | Immigrants from Trinidad and Tobago |
| Minimum | $21,667 | $16,600 |
| Maximum | $55,907 | $60,818 |
| Range | $34,240 | $44,218 |
| Mean | $38,991 | $40,591 |
| Median | $39,248 | $39,706 |
| Interquartile 25% (IQ1) | $35,697 | $36,241 |
| Interquartile 75% (IQ3) | $42,089 | $45,207 |
| Interquartile Range (IQR) | $6,392 | $8,965 |
| Standard Deviation (Sample) | $5,838 | $7,375 |
| Standard Deviation (Population) | $5,797 | $7,342 |
Demographics Similar to Immigrants from South Eastern Asia and Immigrants from Trinidad and Tobago by Median Female Earnings
In terms of median female earnings, the demographic groups most similar to Immigrants from South Eastern Asia are Taiwanese ($40,576, a difference of 0.040%), Serbian ($40,539, a difference of 0.050%), Pakistani ($40,596, a difference of 0.090%), Immigrants from Syria ($40,499, a difference of 0.15%), and Sri Lankan ($40,496, a difference of 0.15%). Similarly, the demographic groups most similar to Immigrants from Trinidad and Tobago are Ugandan ($40,889, a difference of 0.020%), Austrian ($40,923, a difference of 0.070%), Trinidadian and Tobagonian ($40,958, a difference of 0.15%), Carpatho Rusyn ($40,825, a difference of 0.17%), and Guyanese ($40,973, a difference of 0.19%).
| Demographics | Rating | Rank | Median Female Earnings |
| Immigrants | Jordan | 93.5 /100 | #122 | Exceptional $40,977 |
| Guyanese | 93.4 /100 | #123 | Exceptional $40,973 |
| Trinidadians and Tobagonians | 93.2 /100 | #124 | Exceptional $40,958 |
| Austrians | 92.7 /100 | #125 | Exceptional $40,923 |
| Immigrants | Trinidad and Tobago | 92.3 /100 | #126 | Exceptional $40,895 |
| Ugandans | 92.2 /100 | #127 | Exceptional $40,889 |
| Carpatho Rusyns | 91.2 /100 | #128 | Exceptional $40,825 |
| Zimbabweans | 90.8 /100 | #129 | Exceptional $40,798 |
| Immigrants | Guyana | 90.3 /100 | #130 | Exceptional $40,773 |
| Chileans | 90.0 /100 | #131 | Exceptional $40,757 |
| Immigrants | Uganda | 89.7 /100 | #132 | Excellent $40,739 |
| Syrians | 89.5 /100 | #133 | Excellent $40,727 |
| Arabs | 89.3 /100 | #134 | Excellent $40,718 |
| Immigrants | Nepal | 89.0 /100 | #135 | Excellent $40,704 |
| Immigrants | Eastern Africa | 87.7 /100 | #136 | Excellent $40,644 |
| Pakistanis | 86.6 /100 | #137 | Excellent $40,596 |
| Taiwanese | 86.1 /100 | #138 | Excellent $40,576 |
| Immigrants | South Eastern Asia | 85.7 /100 | #139 | Excellent $40,558 |
| Serbians | 85.2 /100 | #140 | Excellent $40,539 |
| Immigrants | Syria | 84.1 /100 | #141 | Excellent $40,499 |
| Sri Lankans | 84.0 /100 | #142 | Excellent $40,496 |