Brazilian vs Immigrants from Trinidad and Tobago Unemployment
COMPARE
Brazilian
Immigrants from Trinidad and Tobago
Unemployment
Unemployment Comparison
Brazilians
Immigrants from Trinidad and Tobago
5.3%
UNEMPLOYMENT
40.2/ 100
METRIC RATING
183rd/ 347
METRIC RANK
6.3%
UNEMPLOYMENT
0.0/ 100
METRIC RATING
300th/ 347
METRIC RANK
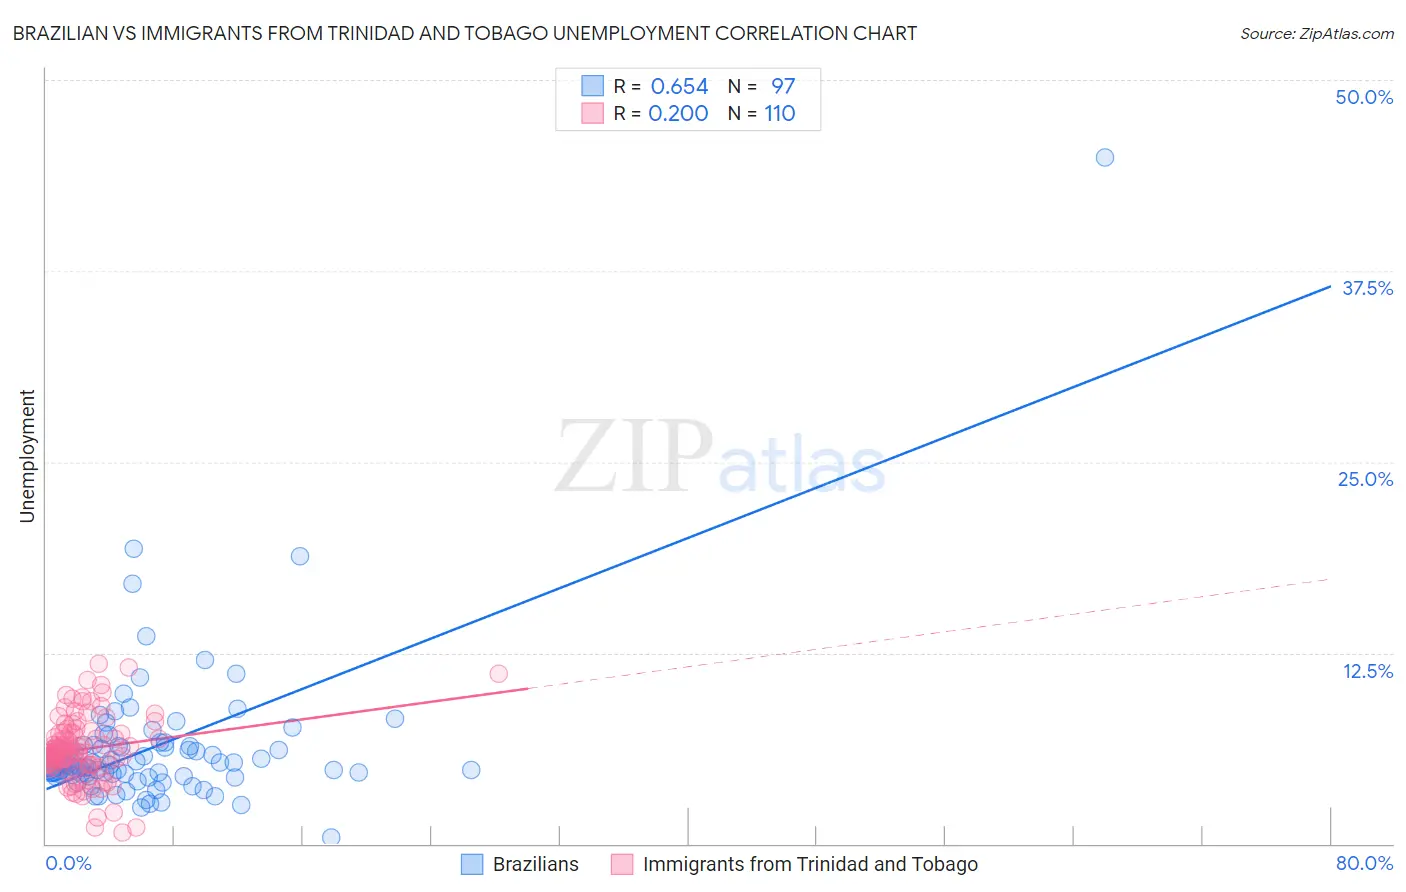
Brazilian vs Immigrants from Trinidad and Tobago Unemployment Correlation Chart
The statistical analysis conducted on geographies consisting of 323,781,873 people shows a significant positive correlation between the proportion of Brazilians and unemployment in the United States with a correlation coefficient (R) of 0.654 and weighted average of 5.3%. Similarly, the statistical analysis conducted on geographies consisting of 223,333,177 people shows a weak positive correlation between the proportion of Immigrants from Trinidad and Tobago and unemployment in the United States with a correlation coefficient (R) of 0.200 and weighted average of 6.3%, a difference of 19.4%.
Unemployment Correlation Summary
| Measurement | Brazilian | Immigrants from Trinidad and Tobago |
| Minimum | 0.40% | 0.70% |
| Maximum | 44.9% | 11.8% |
| Range | 44.5% | 11.1% |
| Mean | 6.3% | 6.2% |
| Median | 5.2% | 6.0% |
| Interquartile 25% (IQ1) | 4.5% | 5.2% |
| Interquartile 75% (IQ3) | 6.4% | 7.2% |
| Interquartile Range (IQR) | 1.9% | 2.0% |
| Standard Deviation (Sample) | 5.0% | 2.1% |
| Standard Deviation (Population) | 5.0% | 2.1% |
Similar Demographics by Unemployment
Demographics Similar to Brazilians by Unemployment
In terms of unemployment, the demographic groups most similar to Brazilians are Assyrian/Chaldean/Syriac (5.3%, a difference of 0.060%), Immigrants from Thailand (5.3%, a difference of 0.080%), Spaniard (5.3%, a difference of 0.13%), Immigrants from Uganda (5.3%, a difference of 0.15%), and Costa Rican (5.3%, a difference of 0.18%).
| Demographics | Rating | Rank | Unemployment |
| Nicaraguans | 48.7 /100 | #176 | Average 5.3% |
| Immigrants | Nonimmigrants | 47.9 /100 | #177 | Average 5.3% |
| Afghans | 47.4 /100 | #178 | Average 5.3% |
| Malaysians | 46.8 /100 | #179 | Average 5.3% |
| Immigrants | Greece | 45.0 /100 | #180 | Average 5.3% |
| Albanians | 43.5 /100 | #181 | Average 5.3% |
| Spaniards | 42.2 /100 | #182 | Average 5.3% |
| Brazilians | 40.2 /100 | #183 | Average 5.3% |
| Assyrians/Chaldeans/Syriacs | 39.2 /100 | #184 | Fair 5.3% |
| Immigrants | Thailand | 38.9 /100 | #185 | Fair 5.3% |
| Immigrants | Uganda | 37.8 /100 | #186 | Fair 5.3% |
| Costa Ricans | 37.4 /100 | #187 | Fair 5.3% |
| Alsatians | 37.0 /100 | #188 | Fair 5.3% |
| Immigrants | Belarus | 35.6 /100 | #189 | Fair 5.3% |
| Arabs | 35.3 /100 | #190 | Fair 5.3% |
Demographics Similar to Immigrants from Trinidad and Tobago by Unemployment
In terms of unemployment, the demographic groups most similar to Immigrants from Trinidad and Tobago are Immigrants from West Indies (6.3%, a difference of 0.12%), Immigrants from Haiti (6.3%, a difference of 0.17%), Jamaican (6.3%, a difference of 0.26%), Trinidadian and Tobagonian (6.3%, a difference of 0.48%), and Ute (6.3%, a difference of 0.60%).
| Demographics | Rating | Rank | Unemployment |
| Immigrants | Ecuador | 0.0 /100 | #293 | Tragic 6.2% |
| Spanish American Indians | 0.0 /100 | #294 | Tragic 6.2% |
| U.S. Virgin Islanders | 0.0 /100 | #295 | Tragic 6.3% |
| Ute | 0.0 /100 | #296 | Tragic 6.3% |
| Jamaicans | 0.0 /100 | #297 | Tragic 6.3% |
| Immigrants | Haiti | 0.0 /100 | #298 | Tragic 6.3% |
| Immigrants | West Indies | 0.0 /100 | #299 | Tragic 6.3% |
| Immigrants | Trinidad and Tobago | 0.0 /100 | #300 | Tragic 6.3% |
| Trinidadians and Tobagonians | 0.0 /100 | #301 | Tragic 6.3% |
| West Indians | 0.0 /100 | #302 | Tragic 6.4% |
| Belizeans | 0.0 /100 | #303 | Tragic 6.4% |
| Immigrants | Jamaica | 0.0 /100 | #304 | Tragic 6.4% |
| Menominee | 0.0 /100 | #305 | Tragic 6.4% |
| Lumbee | 0.0 /100 | #306 | Tragic 6.4% |
| Immigrants | Bangladesh | 0.0 /100 | #307 | Tragic 6.5% |