Immigrants from Romania vs Immigrants from Trinidad and Tobago Median Female Earnings
COMPARE
Immigrants from Romania
Immigrants from Trinidad and Tobago
Median Female Earnings
Median Female Earnings Comparison
Immigrants from Romania
Immigrants from Trinidad and Tobago
$42,718
MEDIAN FEMALE EARNINGS
99.8/ 100
METRIC RATING
71st/ 347
METRIC RANK
$40,895
MEDIAN FEMALE EARNINGS
92.3/ 100
METRIC RATING
126th/ 347
METRIC RANK
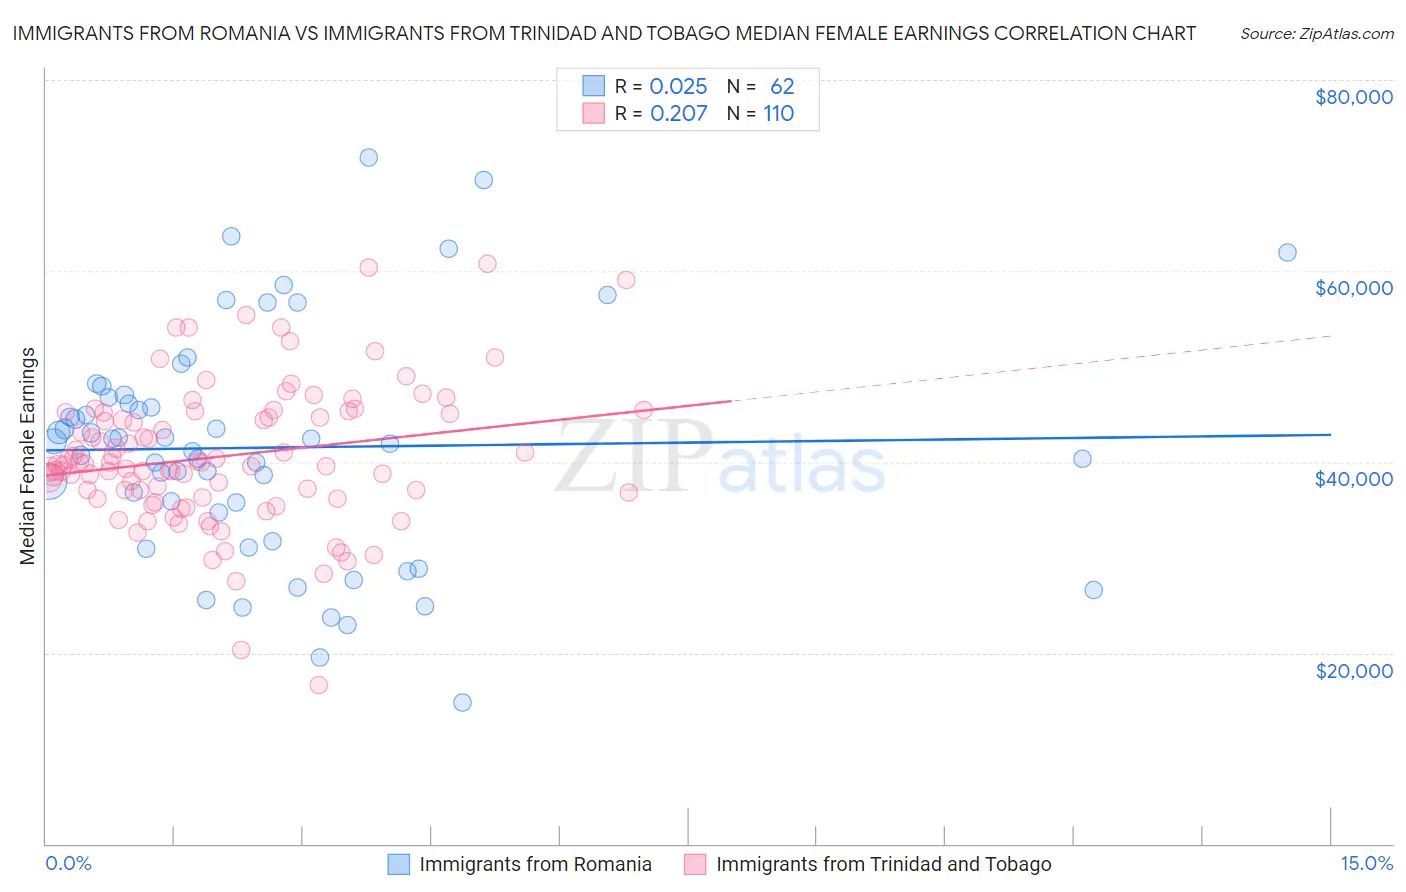
Immigrants from Romania vs Immigrants from Trinidad and Tobago Median Female Earnings Correlation Chart
The statistical analysis conducted on geographies consisting of 256,980,003 people shows no correlation between the proportion of Immigrants from Romania and median female earnings in the United States with a correlation coefficient (R) of 0.025 and weighted average of $42,718. Similarly, the statistical analysis conducted on geographies consisting of 223,490,788 people shows a weak positive correlation between the proportion of Immigrants from Trinidad and Tobago and median female earnings in the United States with a correlation coefficient (R) of 0.207 and weighted average of $40,895, a difference of 4.5%.
Median Female Earnings Correlation Summary
| Measurement | Immigrants from Romania | Immigrants from Trinidad and Tobago |
| Minimum | $14,853 | $16,600 |
| Maximum | $71,891 | $60,818 |
| Range | $57,038 | $44,218 |
| Mean | $41,494 | $40,591 |
| Median | $42,030 | $39,706 |
| Interquartile 25% (IQ1) | $34,661 | $36,241 |
| Interquartile 75% (IQ3) | $46,785 | $45,207 |
| Interquartile Range (IQR) | $12,125 | $8,965 |
| Standard Deviation (Sample) | $12,041 | $7,375 |
| Standard Deviation (Population) | $11,943 | $7,342 |
Similar Demographics by Median Female Earnings
Demographics Similar to Immigrants from Romania by Median Female Earnings
In terms of median female earnings, the demographic groups most similar to Immigrants from Romania are Immigrants from Ethiopia ($42,744, a difference of 0.060%), Immigrants from Spain ($42,815, a difference of 0.23%), Immigrants from Austria ($42,824, a difference of 0.25%), Immigrants from Norway ($42,837, a difference of 0.28%), and Immigrants from Egypt ($42,837, a difference of 0.28%).
| Demographics | Rating | Rank | Median Female Earnings |
| Immigrants | Pakistan | 99.9 /100 | #64 | Exceptional $43,052 |
| Sierra Leoneans | 99.9 /100 | #65 | Exceptional $42,868 |
| Immigrants | Norway | 99.9 /100 | #66 | Exceptional $42,837 |
| Immigrants | Egypt | 99.9 /100 | #67 | Exceptional $42,837 |
| Immigrants | Austria | 99.8 /100 | #68 | Exceptional $42,824 |
| Immigrants | Spain | 99.8 /100 | #69 | Exceptional $42,815 |
| Immigrants | Ethiopia | 99.8 /100 | #70 | Exceptional $42,744 |
| Immigrants | Romania | 99.8 /100 | #71 | Exceptional $42,718 |
| Albanians | 99.8 /100 | #72 | Exceptional $42,584 |
| Mongolians | 99.7 /100 | #73 | Exceptional $42,542 |
| Immigrants | South Africa | 99.7 /100 | #74 | Exceptional $42,508 |
| New Zealanders | 99.7 /100 | #75 | Exceptional $42,446 |
| Immigrants | Italy | 99.7 /100 | #76 | Exceptional $42,446 |
| Immigrants | Albania | 99.6 /100 | #77 | Exceptional $42,388 |
| Immigrants | Kazakhstan | 99.6 /100 | #78 | Exceptional $42,386 |
Demographics Similar to Immigrants from Trinidad and Tobago by Median Female Earnings
In terms of median female earnings, the demographic groups most similar to Immigrants from Trinidad and Tobago are Ugandan ($40,889, a difference of 0.020%), Austrian ($40,923, a difference of 0.070%), Trinidadian and Tobagonian ($40,958, a difference of 0.15%), Carpatho Rusyn ($40,825, a difference of 0.17%), and Guyanese ($40,973, a difference of 0.19%).
| Demographics | Rating | Rank | Median Female Earnings |
| Immigrants | Philippines | 95.0 /100 | #119 | Exceptional $41,114 |
| Immigrants | Kuwait | 94.4 /100 | #120 | Exceptional $41,055 |
| Croatians | 93.7 /100 | #121 | Exceptional $40,993 |
| Immigrants | Jordan | 93.5 /100 | #122 | Exceptional $40,977 |
| Guyanese | 93.4 /100 | #123 | Exceptional $40,973 |
| Trinidadians and Tobagonians | 93.2 /100 | #124 | Exceptional $40,958 |
| Austrians | 92.7 /100 | #125 | Exceptional $40,923 |
| Immigrants | Trinidad and Tobago | 92.3 /100 | #126 | Exceptional $40,895 |
| Ugandans | 92.2 /100 | #127 | Exceptional $40,889 |
| Carpatho Rusyns | 91.2 /100 | #128 | Exceptional $40,825 |
| Zimbabweans | 90.8 /100 | #129 | Exceptional $40,798 |
| Immigrants | Guyana | 90.3 /100 | #130 | Exceptional $40,773 |
| Chileans | 90.0 /100 | #131 | Exceptional $40,757 |
| Immigrants | Uganda | 89.7 /100 | #132 | Excellent $40,739 |
| Syrians | 89.5 /100 | #133 | Excellent $40,727 |