Ugandan vs Immigrants from Trinidad and Tobago Median Female Earnings
COMPARE
Ugandan
Immigrants from Trinidad and Tobago
Median Female Earnings
Median Female Earnings Comparison
Ugandans
Immigrants from Trinidad and Tobago
$40,889
MEDIAN FEMALE EARNINGS
92.2/ 100
METRIC RATING
127th/ 347
METRIC RANK
$40,895
MEDIAN FEMALE EARNINGS
92.3/ 100
METRIC RATING
126th/ 347
METRIC RANK
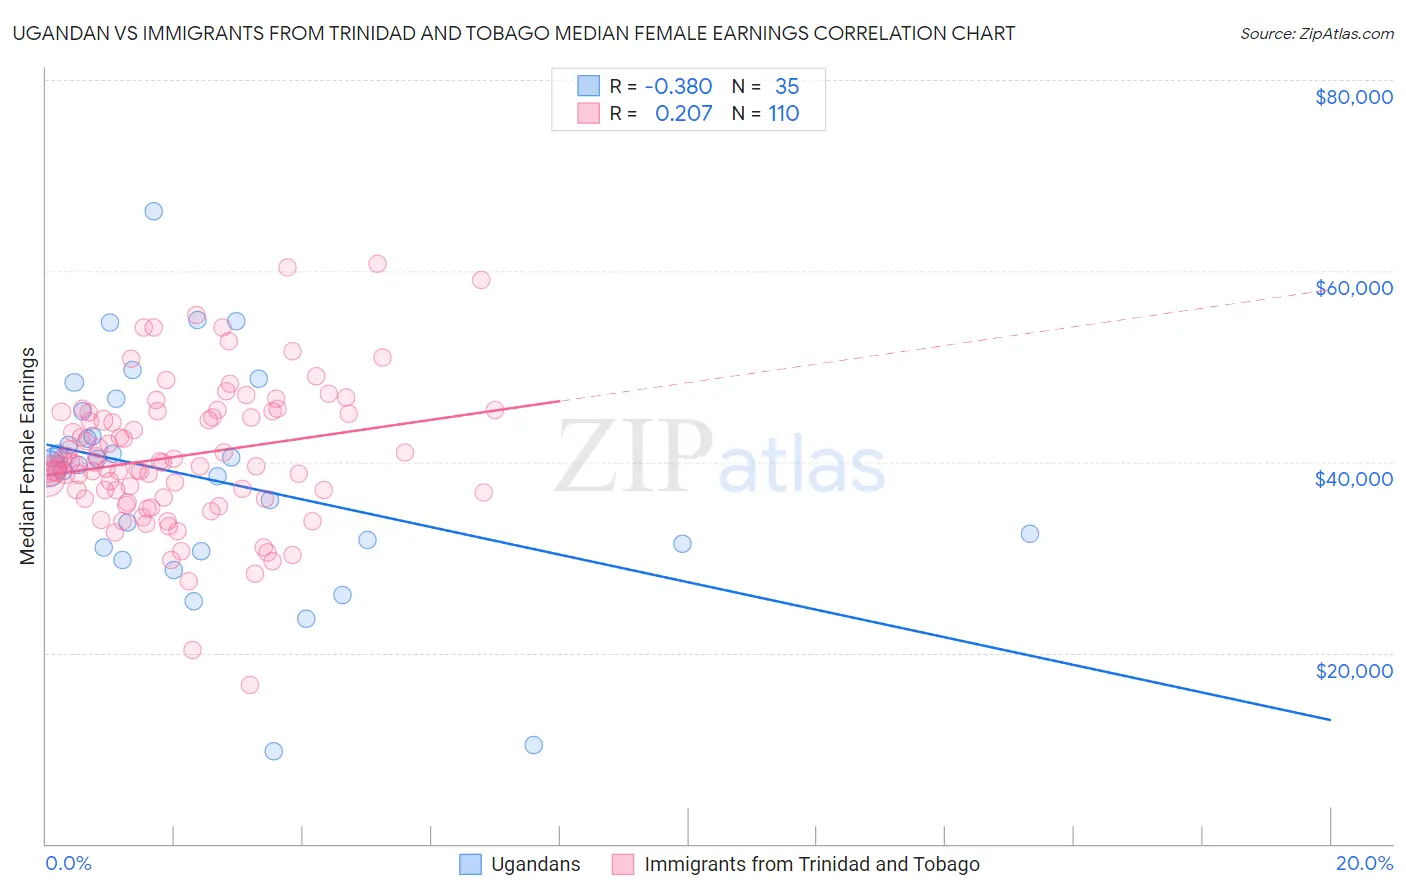
Ugandan vs Immigrants from Trinidad and Tobago Median Female Earnings Correlation Chart
The statistical analysis conducted on geographies consisting of 94,007,517 people shows a mild negative correlation between the proportion of Ugandans and median female earnings in the United States with a correlation coefficient (R) of -0.380 and weighted average of $40,889. Similarly, the statistical analysis conducted on geographies consisting of 223,490,788 people shows a weak positive correlation between the proportion of Immigrants from Trinidad and Tobago and median female earnings in the United States with a correlation coefficient (R) of 0.207 and weighted average of $40,895, a difference of 0.020%.
Median Female Earnings Correlation Summary
| Measurement | Ugandan | Immigrants from Trinidad and Tobago |
| Minimum | $9,732 | $16,600 |
| Maximum | $66,250 | $60,818 |
| Range | $56,518 | $44,218 |
| Mean | $38,170 | $40,591 |
| Median | $39,623 | $39,706 |
| Interquartile 25% (IQ1) | $31,024 | $36,241 |
| Interquartile 75% (IQ3) | $45,270 | $45,207 |
| Interquartile Range (IQR) | $14,246 | $8,965 |
| Standard Deviation (Sample) | $11,739 | $7,375 |
| Standard Deviation (Population) | $11,570 | $7,342 |
Demographics Similar to Ugandans and Immigrants from Trinidad and Tobago by Median Female Earnings
In terms of median female earnings, the demographic groups most similar to Ugandans are Austrian ($40,923, a difference of 0.080%), Carpatho Rusyn ($40,825, a difference of 0.16%), Trinidadian and Tobagonian ($40,958, a difference of 0.17%), Guyanese ($40,973, a difference of 0.21%), and Immigrants from Jordan ($40,977, a difference of 0.22%). Similarly, the demographic groups most similar to Immigrants from Trinidad and Tobago are Austrian ($40,923, a difference of 0.070%), Trinidadian and Tobagonian ($40,958, a difference of 0.15%), Carpatho Rusyn ($40,825, a difference of 0.17%), Guyanese ($40,973, a difference of 0.19%), and Immigrants from Jordan ($40,977, a difference of 0.20%).
| Demographics | Rating | Rank | Median Female Earnings |
| Immigrants | Brazil | 96.4 /100 | #116 | Exceptional $41,273 |
| Barbadians | 96.3 /100 | #117 | Exceptional $41,261 |
| Immigrants | Lebanon | 95.6 /100 | #118 | Exceptional $41,183 |
| Immigrants | Philippines | 95.0 /100 | #119 | Exceptional $41,114 |
| Immigrants | Kuwait | 94.4 /100 | #120 | Exceptional $41,055 |
| Croatians | 93.7 /100 | #121 | Exceptional $40,993 |
| Immigrants | Jordan | 93.5 /100 | #122 | Exceptional $40,977 |
| Guyanese | 93.4 /100 | #123 | Exceptional $40,973 |
| Trinidadians and Tobagonians | 93.2 /100 | #124 | Exceptional $40,958 |
| Austrians | 92.7 /100 | #125 | Exceptional $40,923 |
| Immigrants | Trinidad and Tobago | 92.3 /100 | #126 | Exceptional $40,895 |
| Ugandans | 92.2 /100 | #127 | Exceptional $40,889 |
| Carpatho Rusyns | 91.2 /100 | #128 | Exceptional $40,825 |
| Zimbabweans | 90.8 /100 | #129 | Exceptional $40,798 |
| Immigrants | Guyana | 90.3 /100 | #130 | Exceptional $40,773 |
| Chileans | 90.0 /100 | #131 | Exceptional $40,757 |
| Immigrants | Uganda | 89.7 /100 | #132 | Excellent $40,739 |
| Syrians | 89.5 /100 | #133 | Excellent $40,727 |
| Arabs | 89.3 /100 | #134 | Excellent $40,718 |
| Immigrants | Nepal | 89.0 /100 | #135 | Excellent $40,704 |
| Immigrants | Eastern Africa | 87.7 /100 | #136 | Excellent $40,644 |